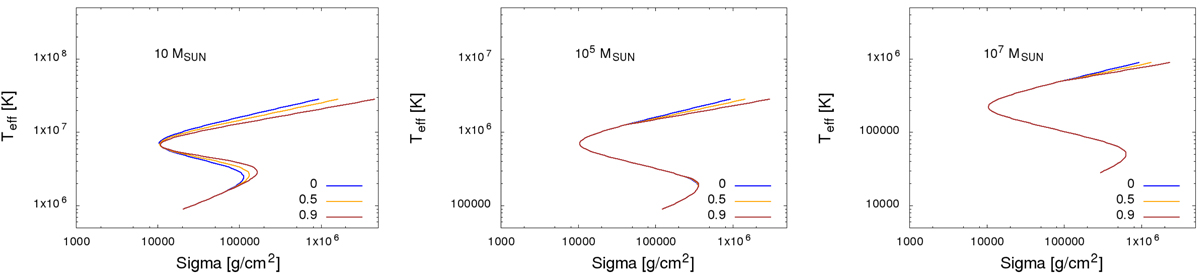
Fig. 4.
Download original image
Local stability curves for black hole masses for 10 M⊙ (left panel), 105 M⊙ (middle panel), and 107 M⊙ (right panel). For each curve, we keep R = 10Rschw and α = 0.01. The color of the S-curve represents different coefficient values for model B: blue for b′ = 0 (base model), orange for b′ = 0.5, and brown for b′ = 0.9. For each plot, we keep the same X-axis and the same range (3 orders of magnitude) for the Y-axis.
Current usage metrics show cumulative count of Article Views (full-text article views including HTML views, PDF and ePub downloads, according to the available data) and Abstracts Views on Vision4Press platform.
Data correspond to usage on the plateform after 2015. The current usage metrics is available 48-96 hours after online publication and is updated daily on week days.
Initial download of the metrics may take a while.