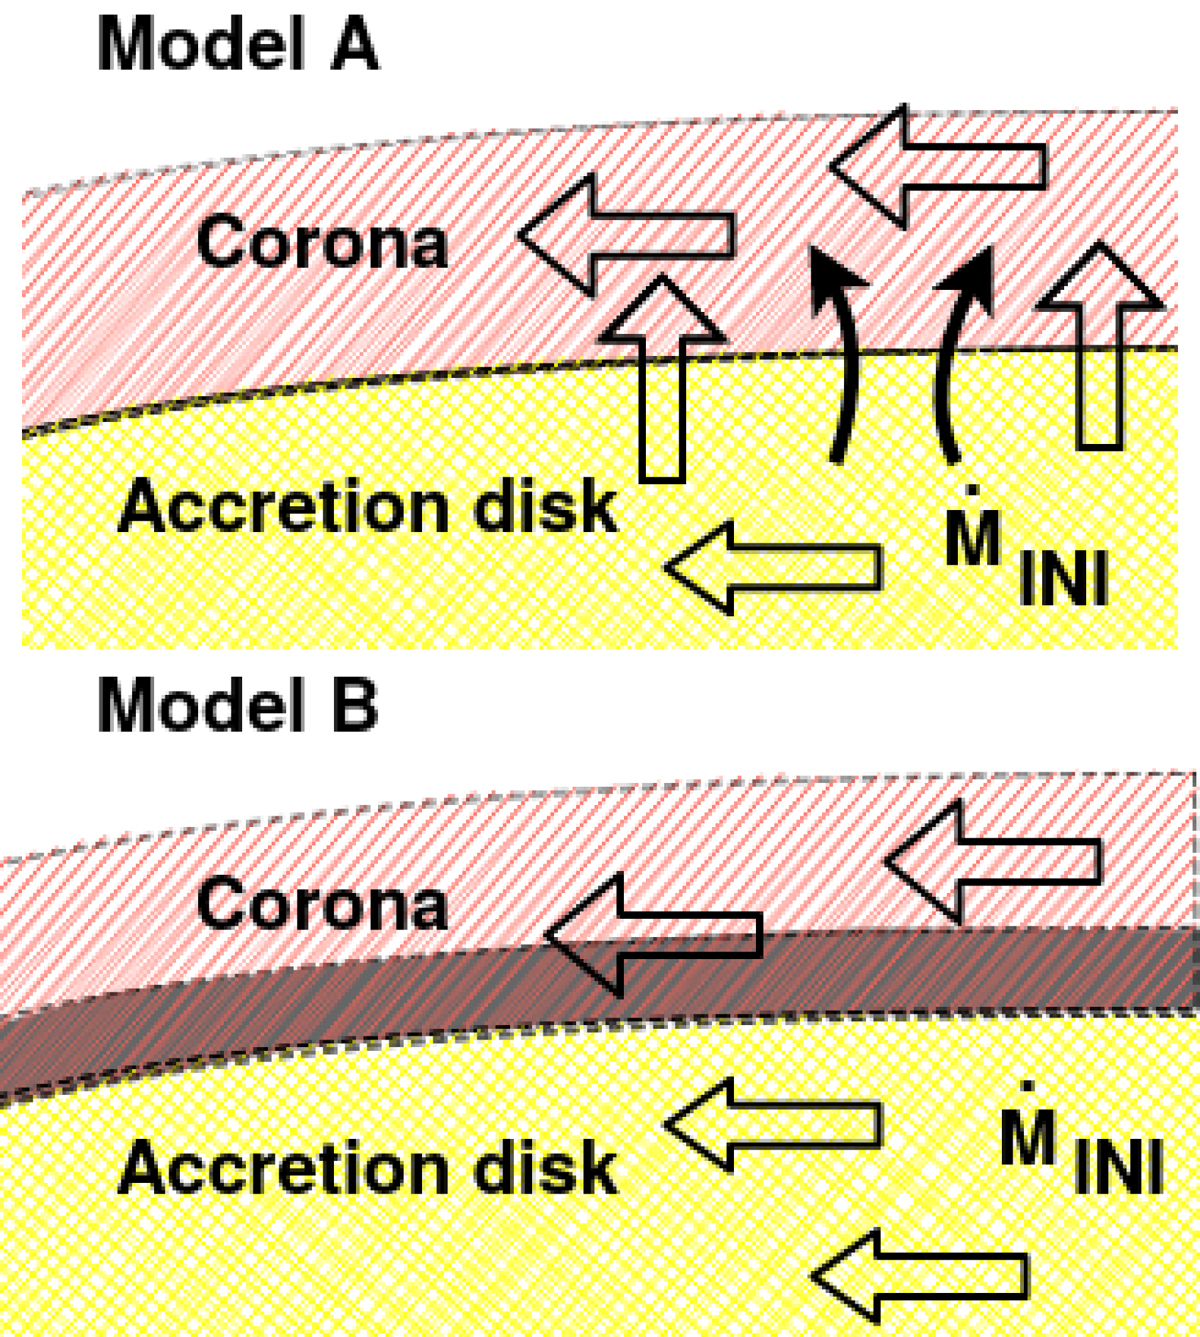
Fig. 2.
Download original image
Zoomed-in schematic view of the accretion flow from Fig. 1 with the modified structures that were introduced in the disk. Model A (upper panel) shows the energy transfer by the magnetic field in the form of Alfvén waves, represented as solid curved black arrows. Model B (bottom panel) shows the dead zone in the gray area between the corona and the accretion disk.
Current usage metrics show cumulative count of Article Views (full-text article views including HTML views, PDF and ePub downloads, according to the available data) and Abstracts Views on Vision4Press platform.
Data correspond to usage on the plateform after 2015. The current usage metrics is available 48-96 hours after online publication and is updated daily on week days.
Initial download of the metrics may take a while.