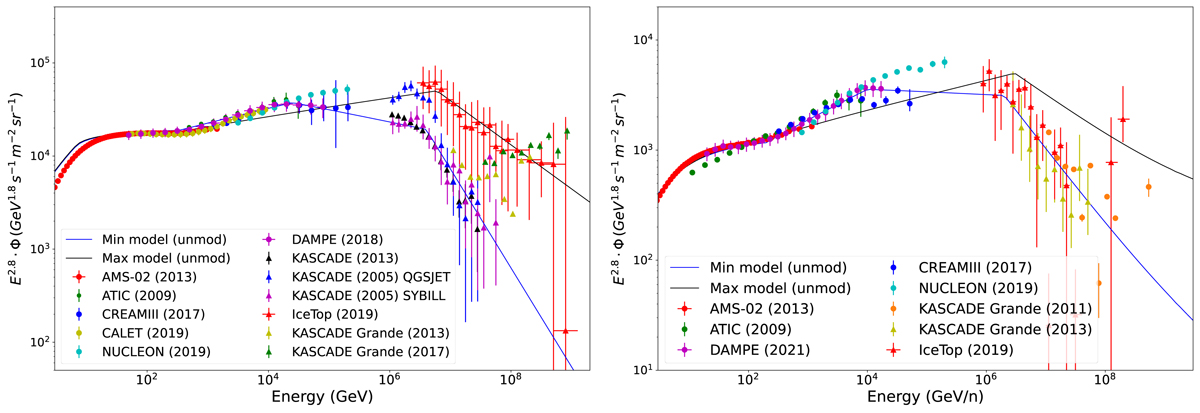
Fig. 1.
Download original image
Proton (left panel) and helium (right panel) local spectra computed for the γ-optimized scenario are plotted against a representative set of data. For each species the spectra as predicted using the Max and Min source spectrum setups are shown. The corresponding lines computed for the Base scenario are not shown since they are almost coincident with those reported here above 10 GeV n−1 (at the Solar System position).
Current usage metrics show cumulative count of Article Views (full-text article views including HTML views, PDF and ePub downloads, according to the available data) and Abstracts Views on Vision4Press platform.
Data correspond to usage on the plateform after 2015. The current usage metrics is available 48-96 hours after online publication and is updated daily on week days.
Initial download of the metrics may take a while.