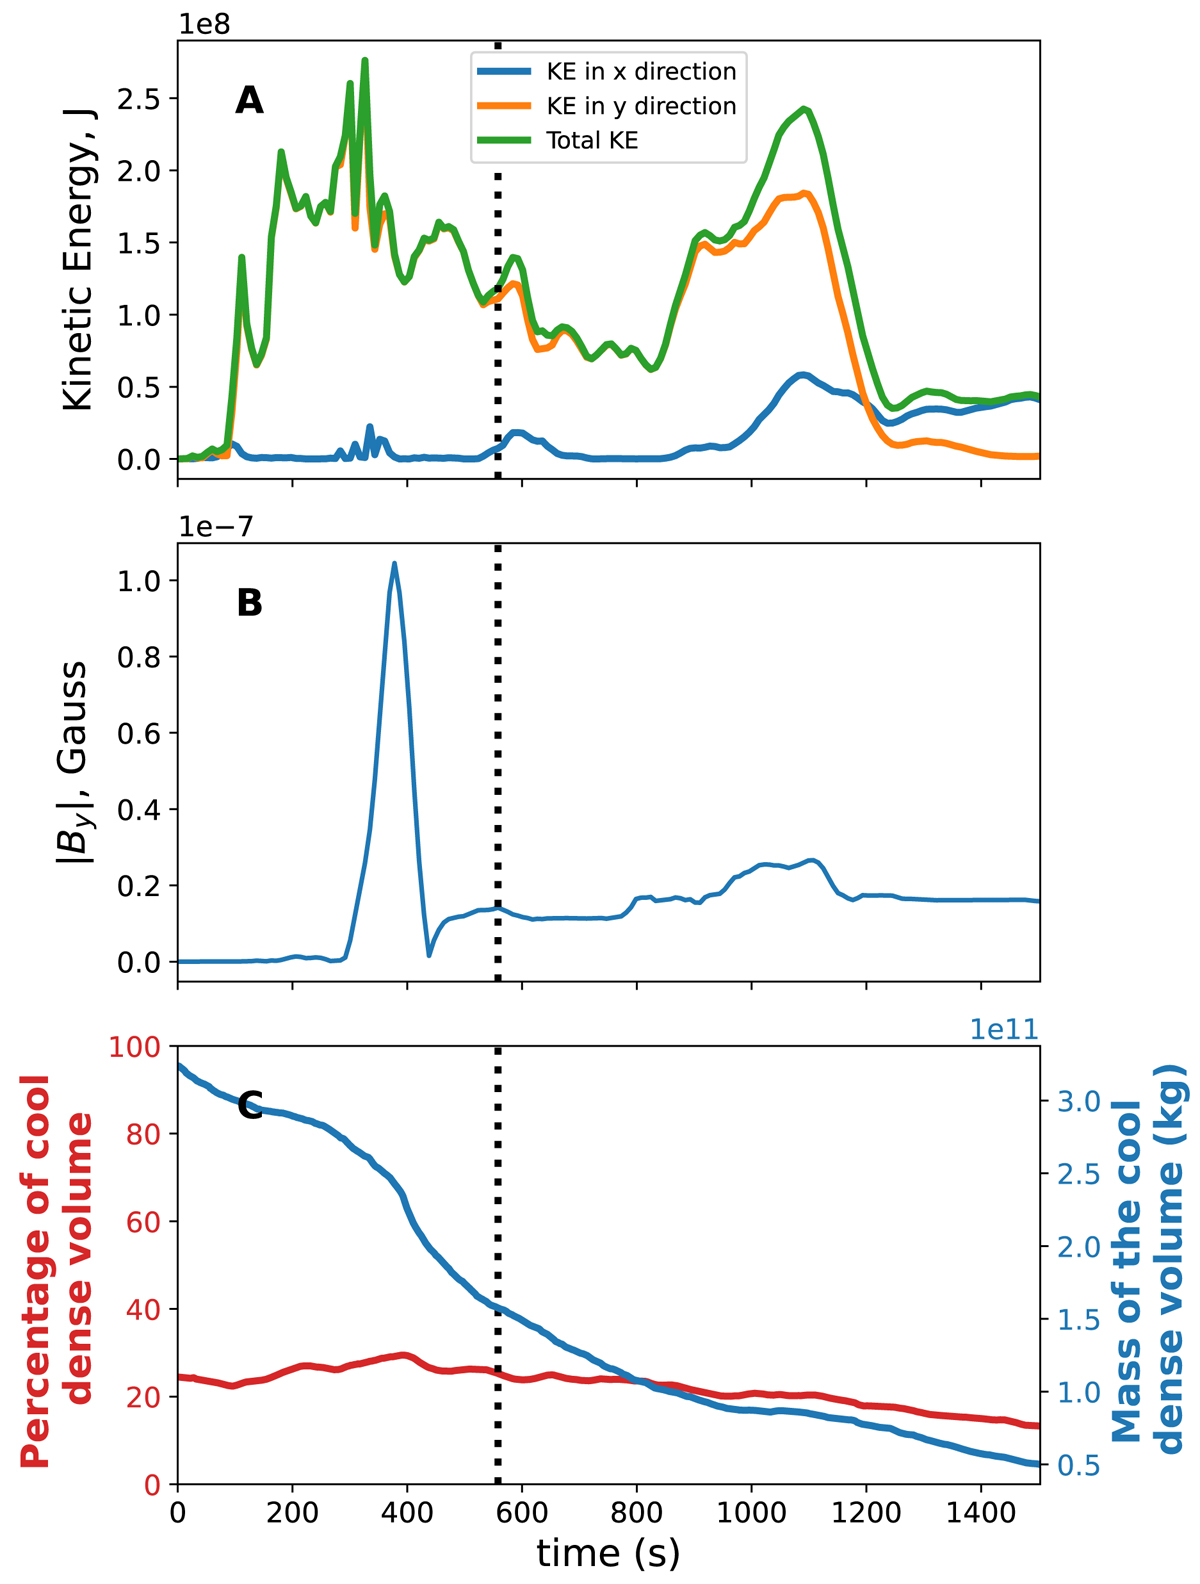
Fig. 8.
Download original image
Temporal evolution of physical quantities of the prominence. Panel A: Time evolution of the volume-averaged kinetic energy across the domain in the x and y directions and the volume-averaged total kinetic energy of the prominence. Panel B: Time evolution of the mean magnitude of the prominence’s vertical magnetic component, By (volume-averaged). Panel C: Evolution over time of the volume percentage of cool dense solar prominence (plus coronal interface) material, that is, excluding the chromosphere, taken below a threshold temperature of 5 × 10⁴ K, and denser than 10−11 kg m−3 (cf. Fig. 2), is plotted together with its corresponding mass. The dotted black line in Panel C represents the time 558.15 s, when the turbulence analysis was done.
Current usage metrics show cumulative count of Article Views (full-text article views including HTML views, PDF and ePub downloads, according to the available data) and Abstracts Views on Vision4Press platform.
Data correspond to usage on the plateform after 2015. The current usage metrics is available 48-96 hours after online publication and is updated daily on week days.
Initial download of the metrics may take a while.