Fig. 4.
Download original image
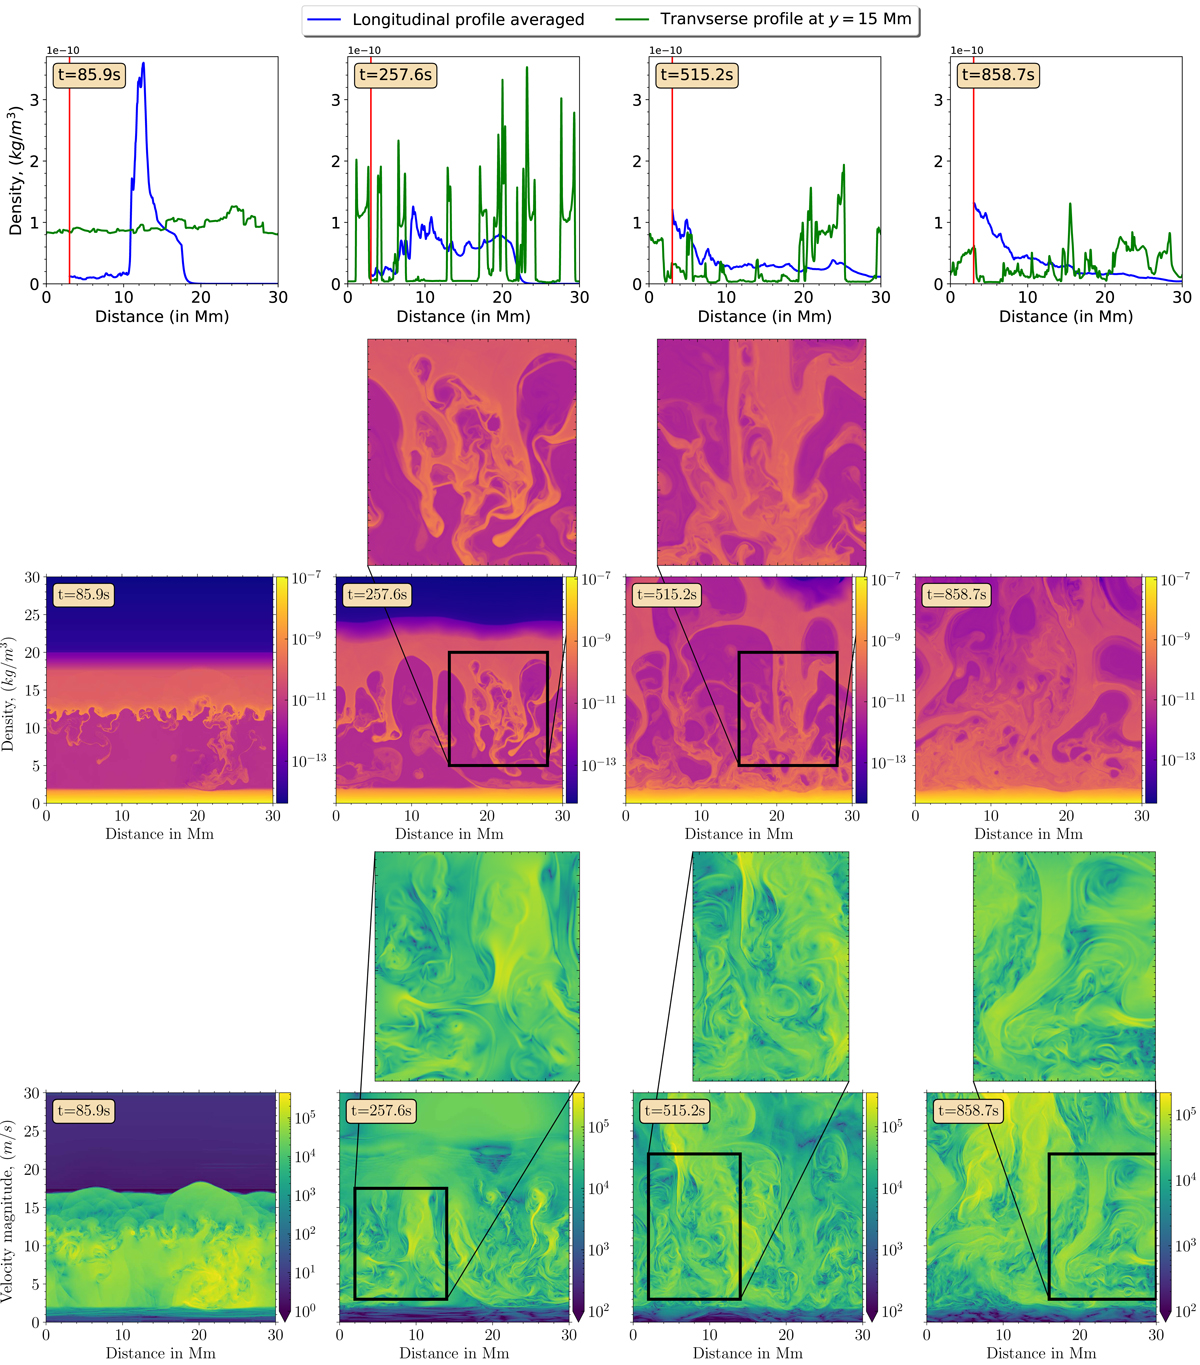
Density profile (top) for longitudinally averaged (blue) and transverse profile at height y = 15 Mm (green) for each time. Time evolution of the density (middle) and velocity magnitude (bottom) for a case of θ = 88.5°. At time 85.9 s, the RT instability forms at the lower prominence-corona interface, corresponding to the early nonlinear phase. At time 257.6 s, the perturbed layer undergoes deformation due to the RT instability and forms bubbles and plumes as it transits to the later nonlinear phase. At time 515.2 s, the nonlinear phase further develops as part of the matter gets reflected upward, and we see the formation of further substructures on the edges of bubbles and plumes. At time 858.7 s, many small-scale structures in the prominence form, which transfer energy to intermediate scales, and turbulence is prominent at this time.
Current usage metrics show cumulative count of Article Views (full-text article views including HTML views, PDF and ePub downloads, according to the available data) and Abstracts Views on Vision4Press platform.
Data correspond to usage on the plateform after 2015. The current usage metrics is available 48-96 hours after online publication and is updated daily on week days.
Initial download of the metrics may take a while.