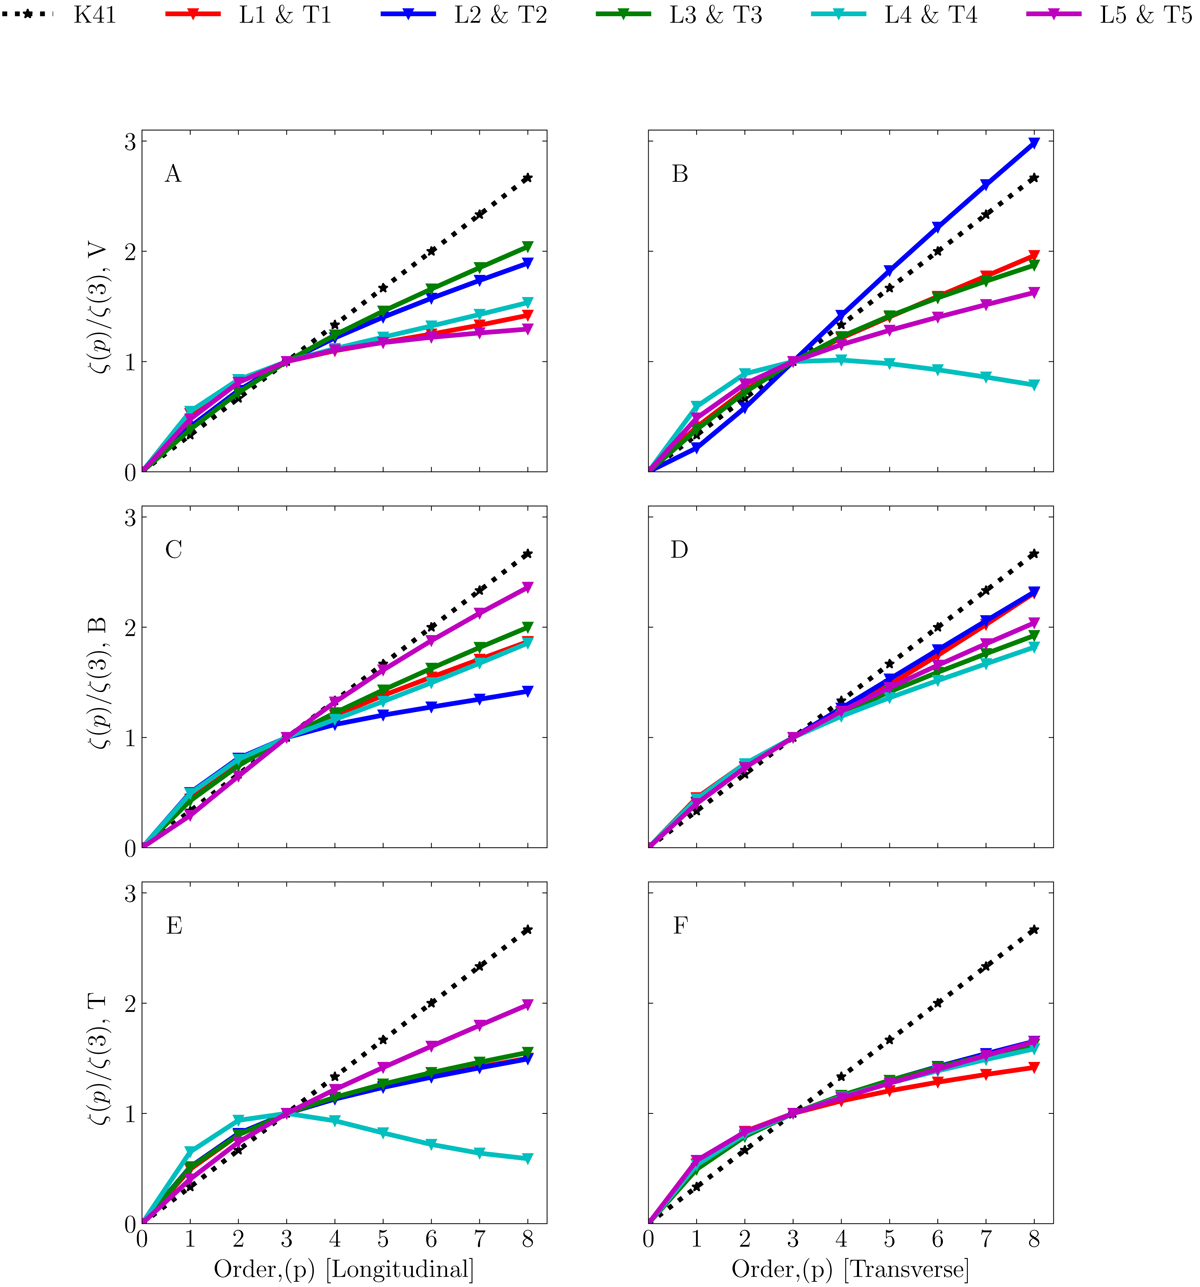
Fig. 17.
Download original image
Scaling exponent ζ(p)/ζ(3), inferred from the different slopes from Fig. 16 for the longitudinal (left) and transverse strips (right) for the velocity (A and B), magnetic (C and D), and temperature field (E and F) plotted versus order p, which goes from 1 to 8 at time 558.15 s. The dotted black line here represents the K41 self-similarity line or linear line (p/3).
Current usage metrics show cumulative count of Article Views (full-text article views including HTML views, PDF and ePub downloads, according to the available data) and Abstracts Views on Vision4Press platform.
Data correspond to usage on the plateform after 2015. The current usage metrics is available 48-96 hours after online publication and is updated daily on week days.
Initial download of the metrics may take a while.