Fig. 15.
Download original image
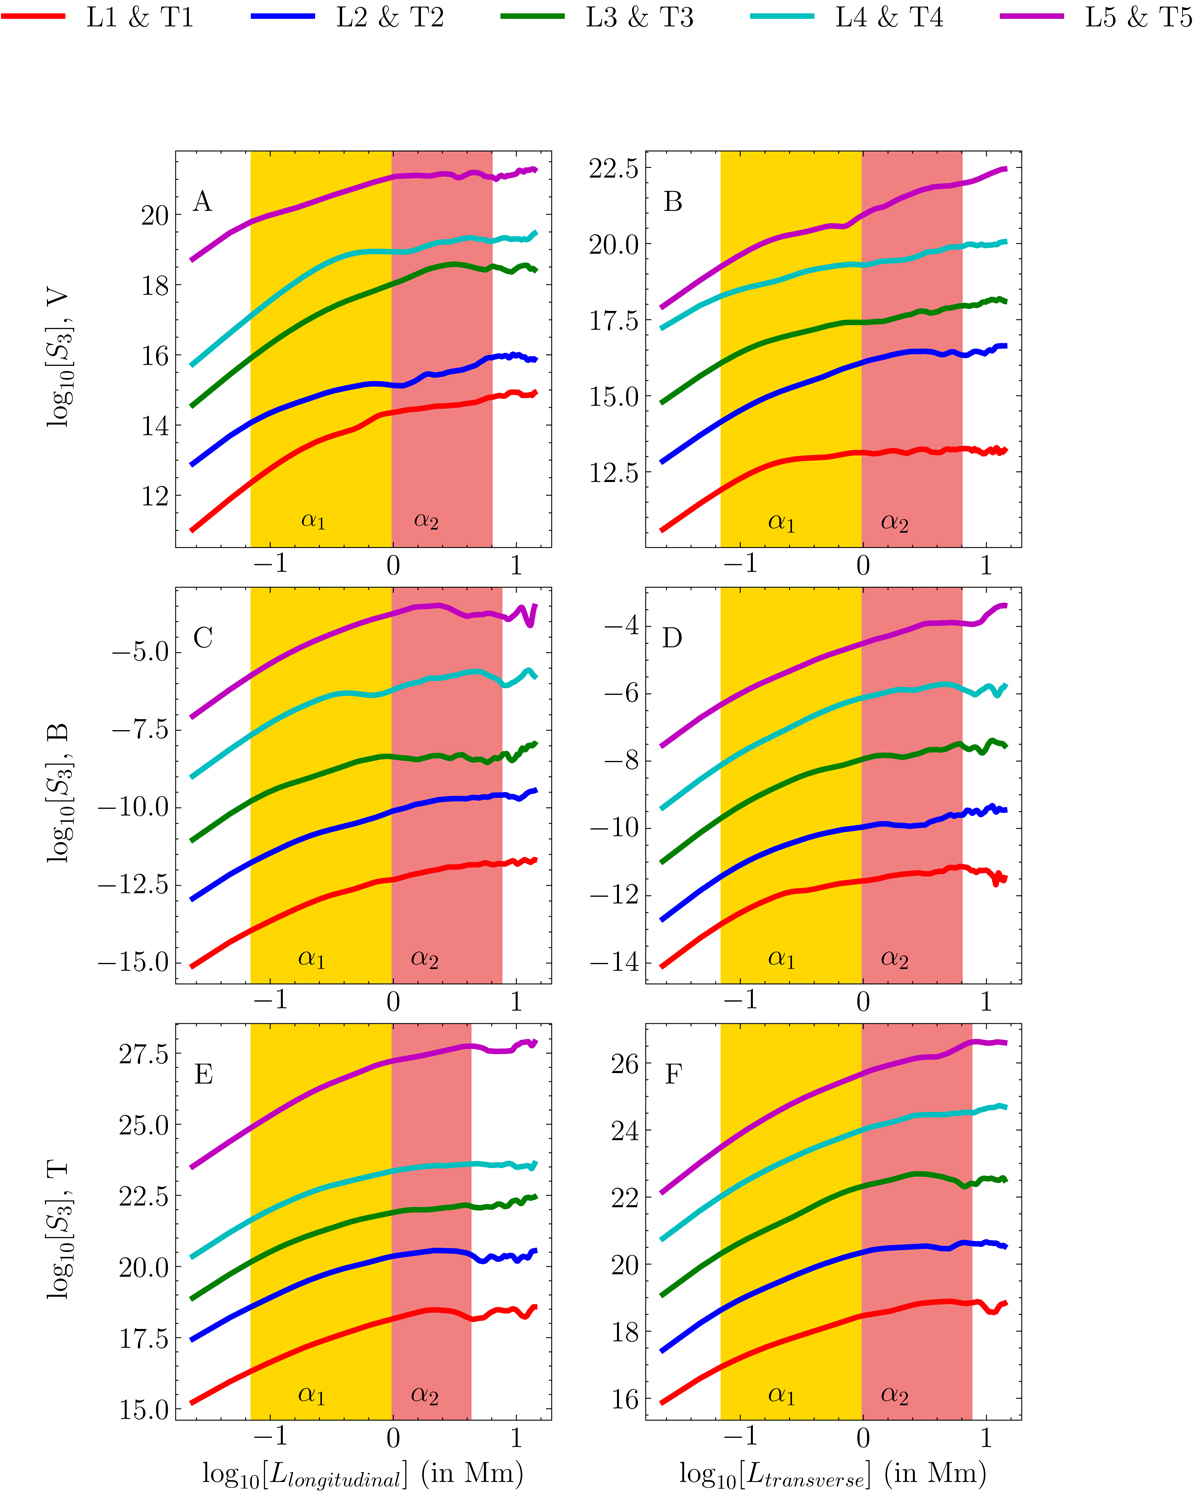
SF (log-log) third order for longitudinal, L1–L5 (left), and transverse strips, T1–T5 (right), of the velocity field (A and B), magnetic field (C and D), and temperature field (E and F) at the reference time = 558.15 s. All the SFs are shifted on the y-axis for clarity. The rate of intermittency decreases with an increase in scales for A, B, C, D, E, and F. The yellow (α1) and light coral (α2) area mark the wavenumber between which the two error fits of power-law exponents are done for the scales of the individual strips. The values of these fits are given in Table 2.
Current usage metrics show cumulative count of Article Views (full-text article views including HTML views, PDF and ePub downloads, according to the available data) and Abstracts Views on Vision4Press platform.
Data correspond to usage on the plateform after 2015. The current usage metrics is available 48-96 hours after online publication and is updated daily on week days.
Initial download of the metrics may take a while.