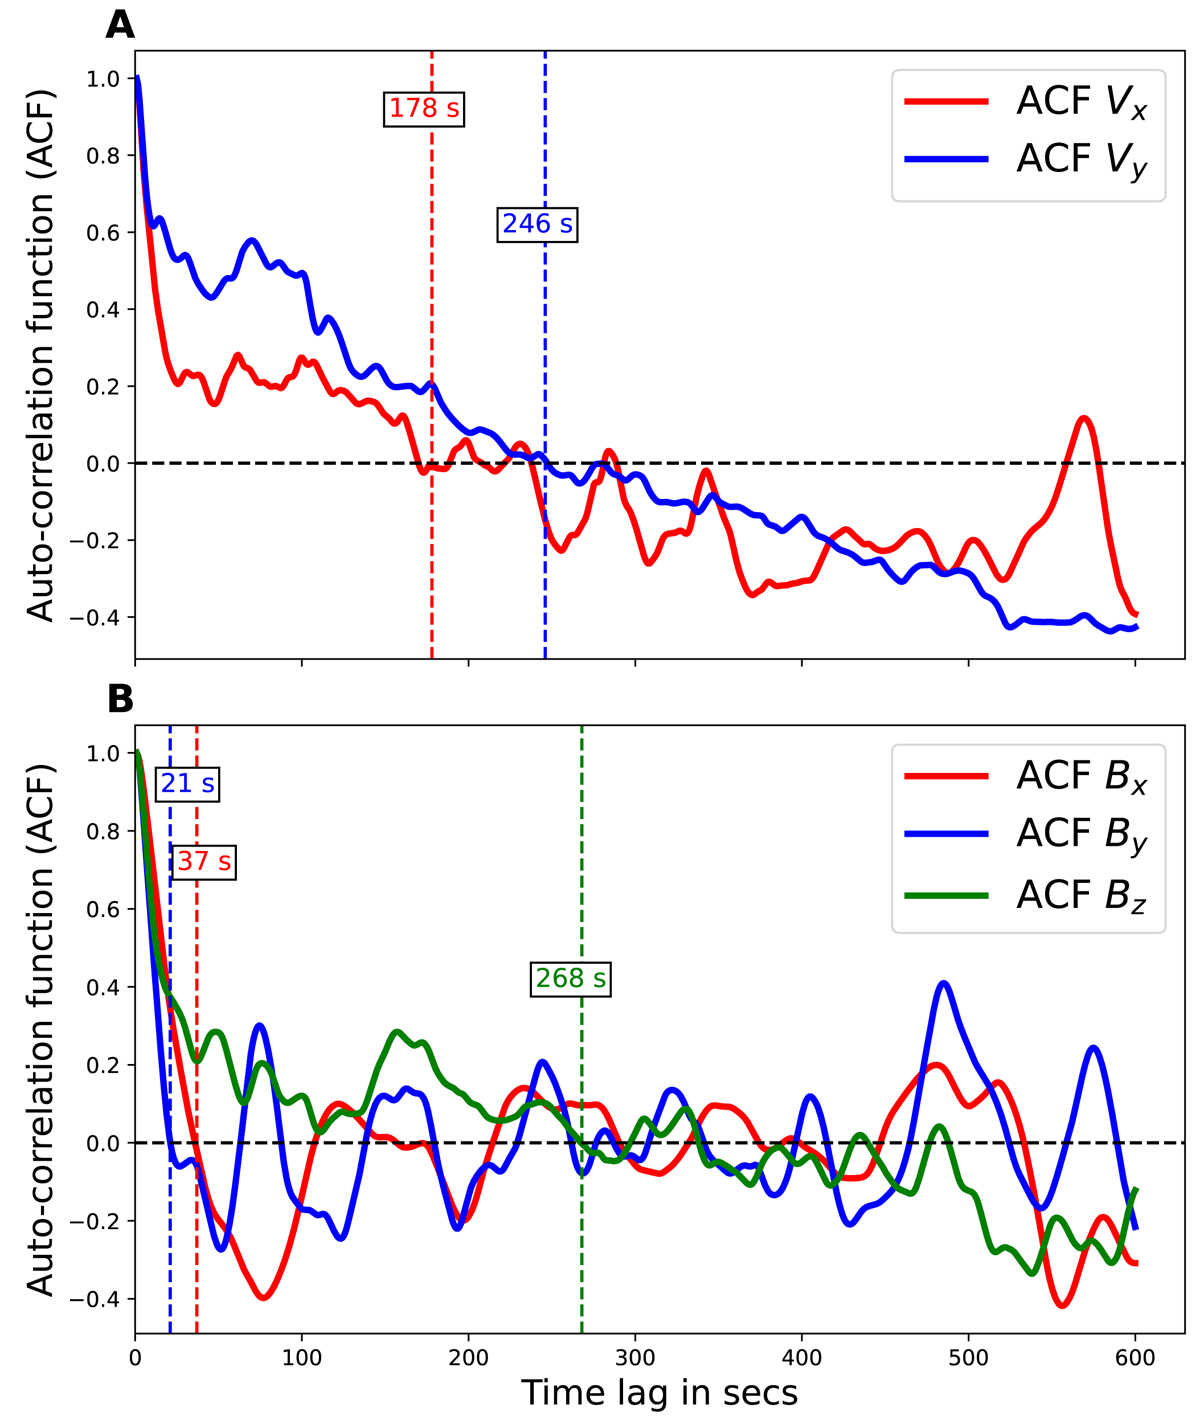
Fig. 12.
Download original image
Correlation timescales of individual velocity and magnetic field components. Panel A: Normalized temporal autocorrelation function for the x and y components of the velocity field at the center of the simulation box (Point A in Fig. 9). B: Normalized temporal autocorrelation function for the x, y, and z components of the magnetic field at the same location. Vy has the highest correlation timescale, 246 s, for the velocity components, compared to 178 s for Vx. Similarly, Bz has the highest correlation timescale, 268 s, compared to Bx with 37 s and By with 21 s.
Current usage metrics show cumulative count of Article Views (full-text article views including HTML views, PDF and ePub downloads, according to the available data) and Abstracts Views on Vision4Press platform.
Data correspond to usage on the plateform after 2015. The current usage metrics is available 48-96 hours after online publication and is updated daily on week days.
Initial download of the metrics may take a while.