Fig. 6
Download original image
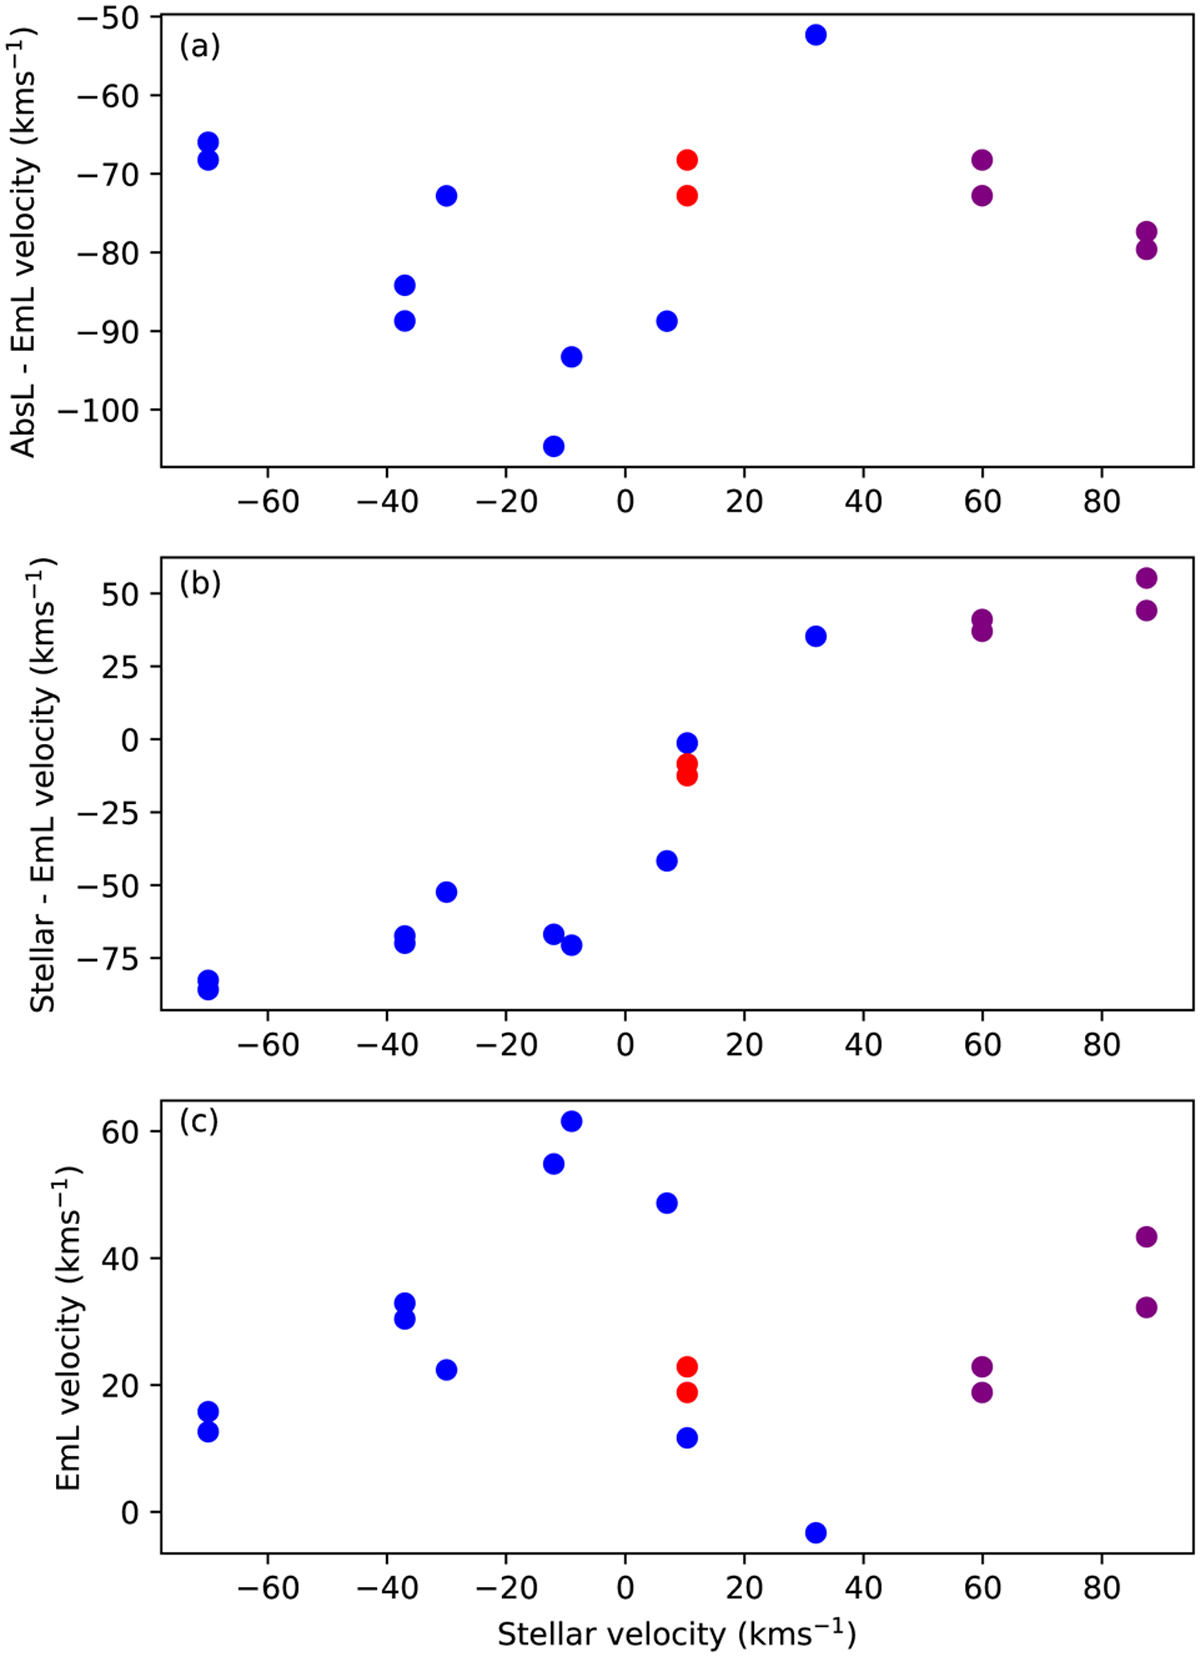
(a) Difference in absorption and emission line peak velocity around 1318 nm plotted against the stellar velocity, (b) The same for stellar velocity minus emission line velocity, (c) Emission line velocity versus stellar velocity, assuming the emission line has a rest wavelength of 1317.37 nm. Results with the same stellar velocities are from repeat observations of a given star. Purple points are from Gaia DR2 with Red points from Gaia DR3 for HD 160065.
Current usage metrics show cumulative count of Article Views (full-text article views including HTML views, PDF and ePub downloads, according to the available data) and Abstracts Views on Vision4Press platform.
Data correspond to usage on the plateform after 2015. The current usage metrics is available 48-96 hours after online publication and is updated daily on week days.
Initial download of the metrics may take a while.