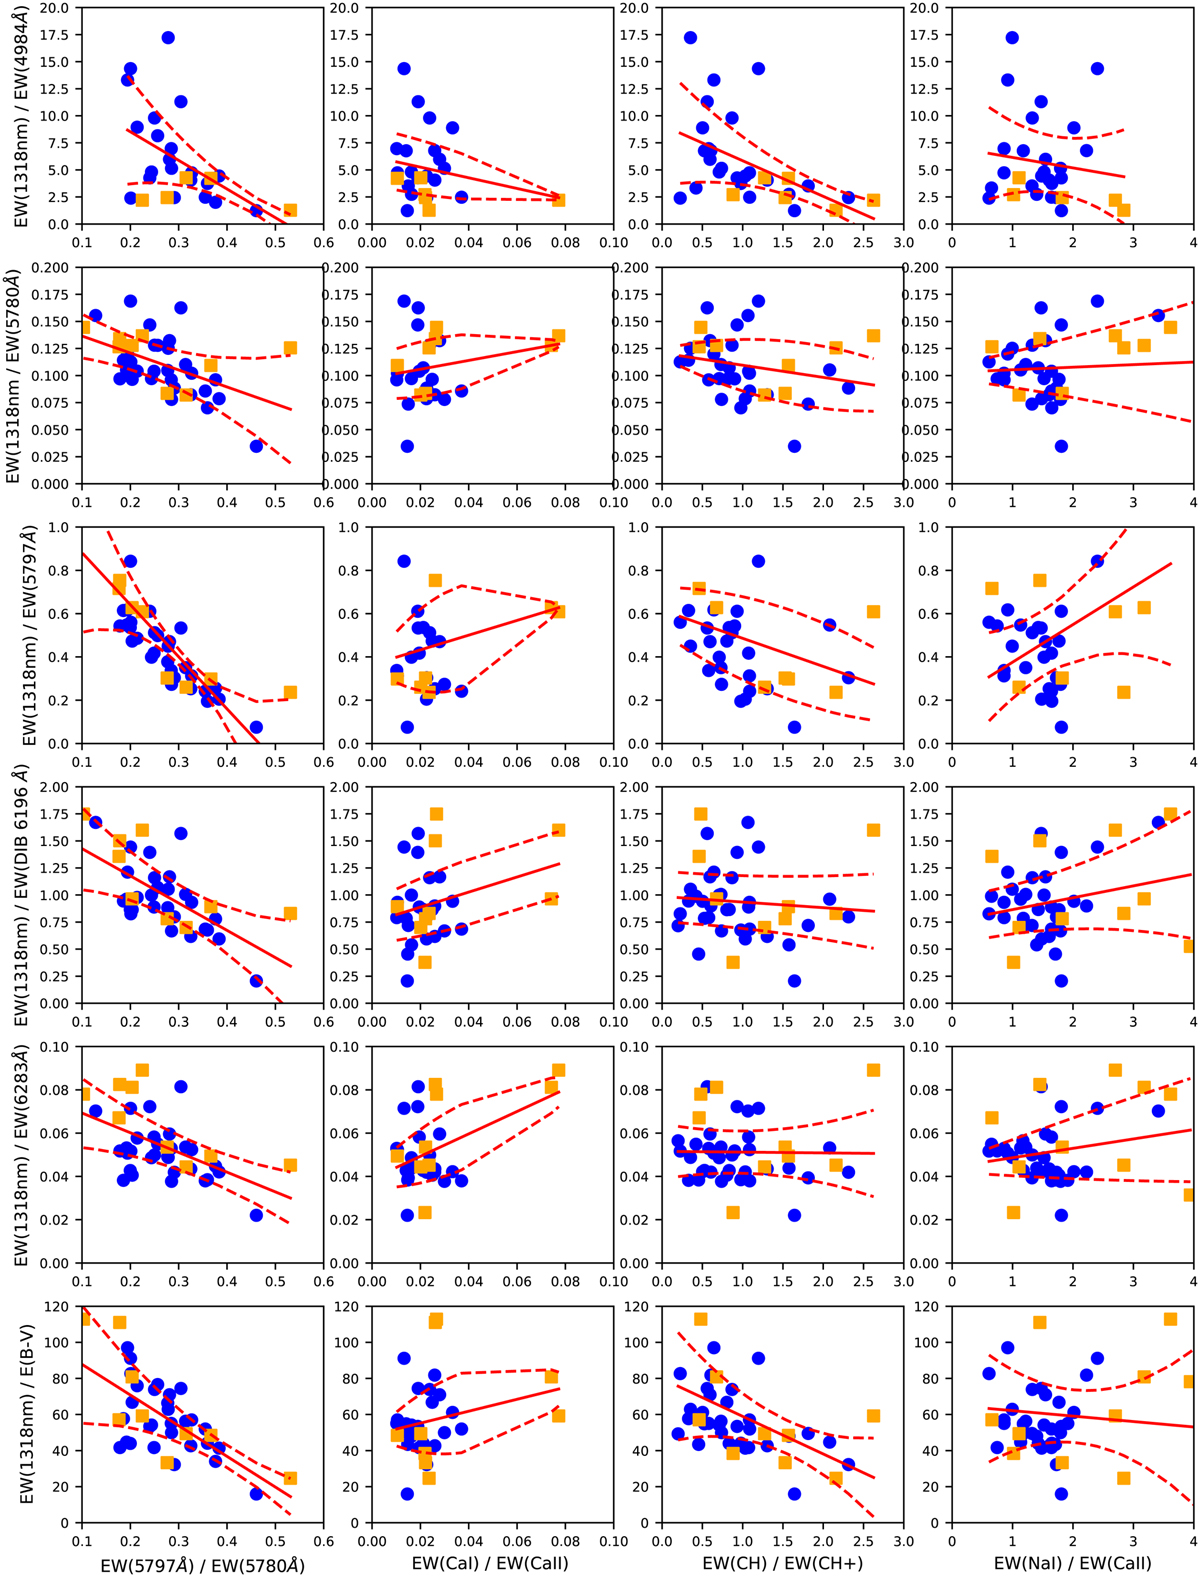
Fig. 21
Download original image
Ratio of the EW of the 1318 nm NIR DIB divided by the EW of optical DIBs or E(B – V) plotted against (1) λλ5797/5780 ratio, (2) Ca I (4226 Å)/Ca II (3933 Å), (3) CH (4300 Å)/CH+ (4232 Å) and (4) Na I (5895 Å)/Ca II (3933 Å). Blue circles are for the whole sample, and orange squares show the single component dominated DIBs. The dashed lines show upper and lower error bounds obtained by fitting with a second order polynomial.
Current usage metrics show cumulative count of Article Views (full-text article views including HTML views, PDF and ePub downloads, according to the available data) and Abstracts Views on Vision4Press platform.
Data correspond to usage on the plateform after 2015. The current usage metrics is available 48-96 hours after online publication and is updated daily on week days.
Initial download of the metrics may take a while.