Open Access
Fig. 20
Download original image
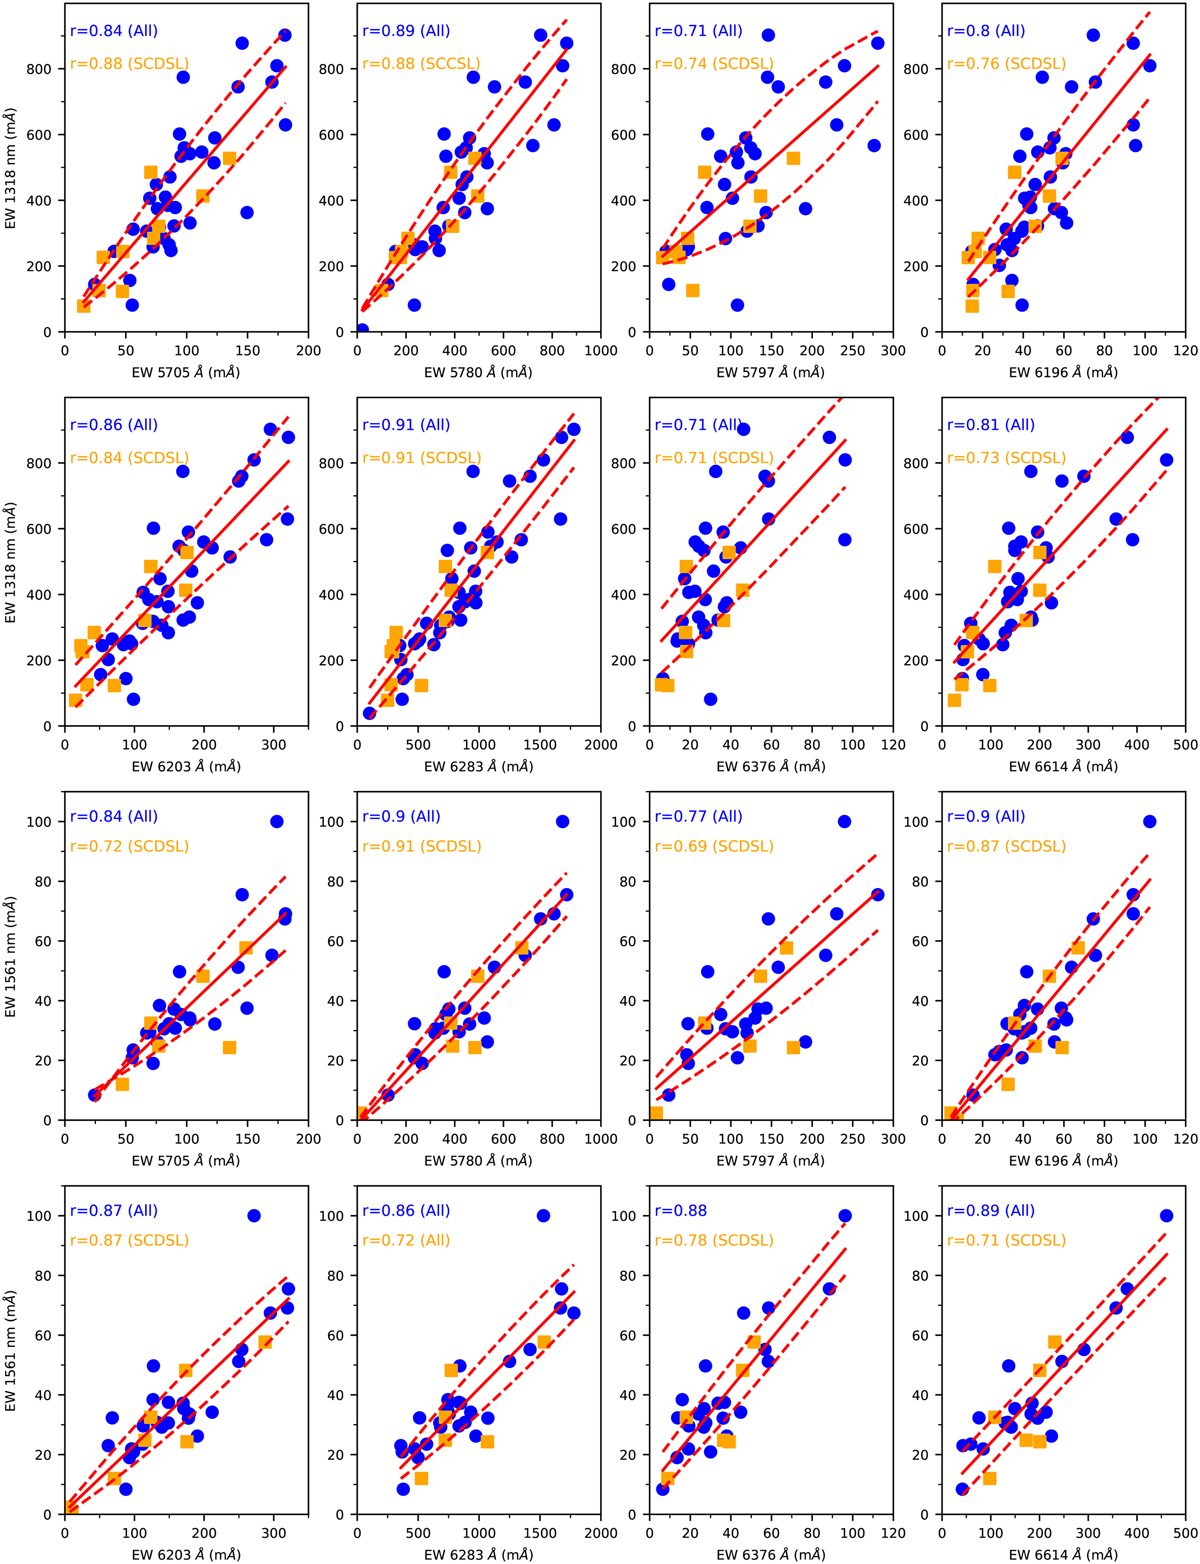
Correlations in EW in mÅ for the 1318 nm and 1561 nm DIBs in the current sample towards the optical DIBs where the highest correlation coefficients were observed. The dashed lines show upper and lower error bounds obtained by fitting with a second order polynomial.
Current usage metrics show cumulative count of Article Views (full-text article views including HTML views, PDF and ePub downloads, according to the available data) and Abstracts Views on Vision4Press platform.
Data correspond to usage on the plateform after 2015. The current usage metrics is available 48-96 hours after online publication and is updated daily on week days.
Initial download of the metrics may take a while.