Fig. 2
Download original image
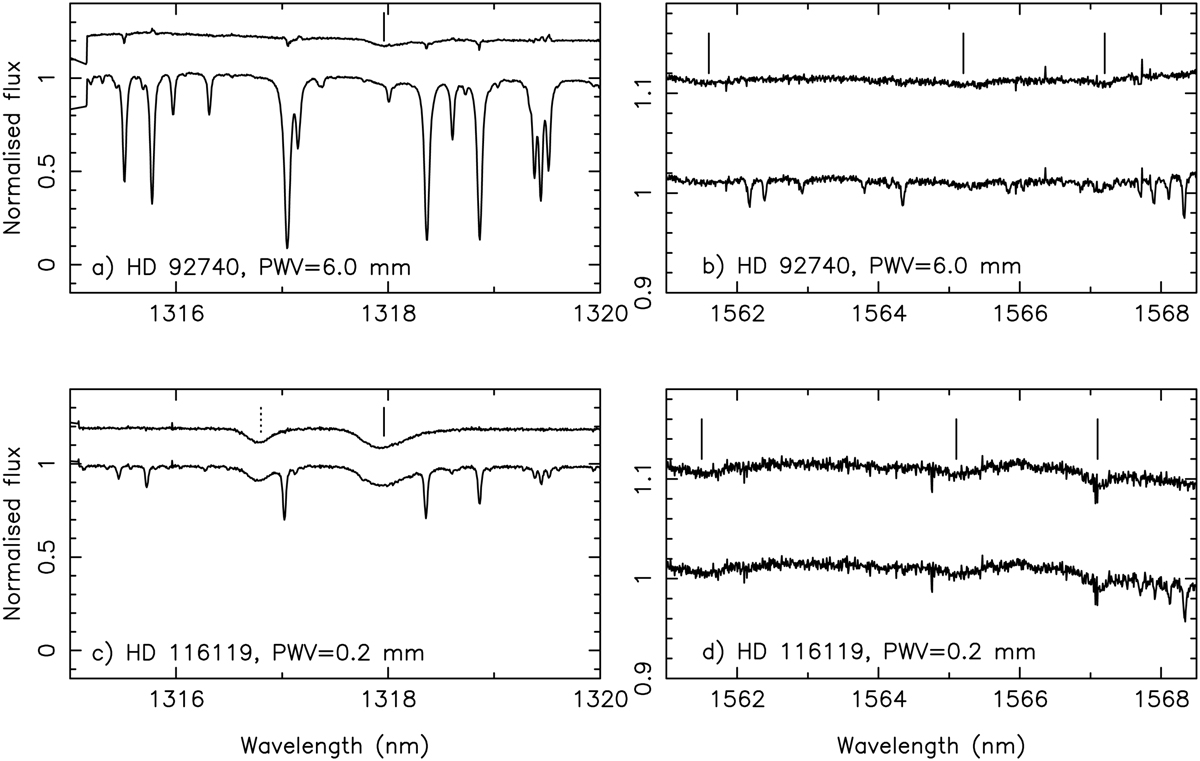
Examples for two wavelength regions of the use of MOLECFIT to remove telluric lines from spectra when the PWV was ~6.0 mm (plots a and b) and ~0.2 mm (plots c and d) for HD 92740 and HD 116119. Spectra have been normalised. The median nighttime PWV for Paranal is 2.4 mm (Kerber et al. 2014). The lower spectra in each panel are the reduced data. The upper spectra are the same objects after telluric correction (offset in the ordinate for clarity). Vertical lines above the corrected spectra indicate the DIBs at 1318.1, 1561.1, 1565.1, and 1567.0 nm. Vacuum wavelengths are shown. The dashed vertical line displayed for HD 116119 at a wavelength of 1316.8 nm indicates a likely stellar feature caused by an O I triplet.
Current usage metrics show cumulative count of Article Views (full-text article views including HTML views, PDF and ePub downloads, according to the available data) and Abstracts Views on Vision4Press platform.
Data correspond to usage on the plateform after 2015. The current usage metrics is available 48-96 hours after online publication and is updated daily on week days.
Initial download of the metrics may take a while.