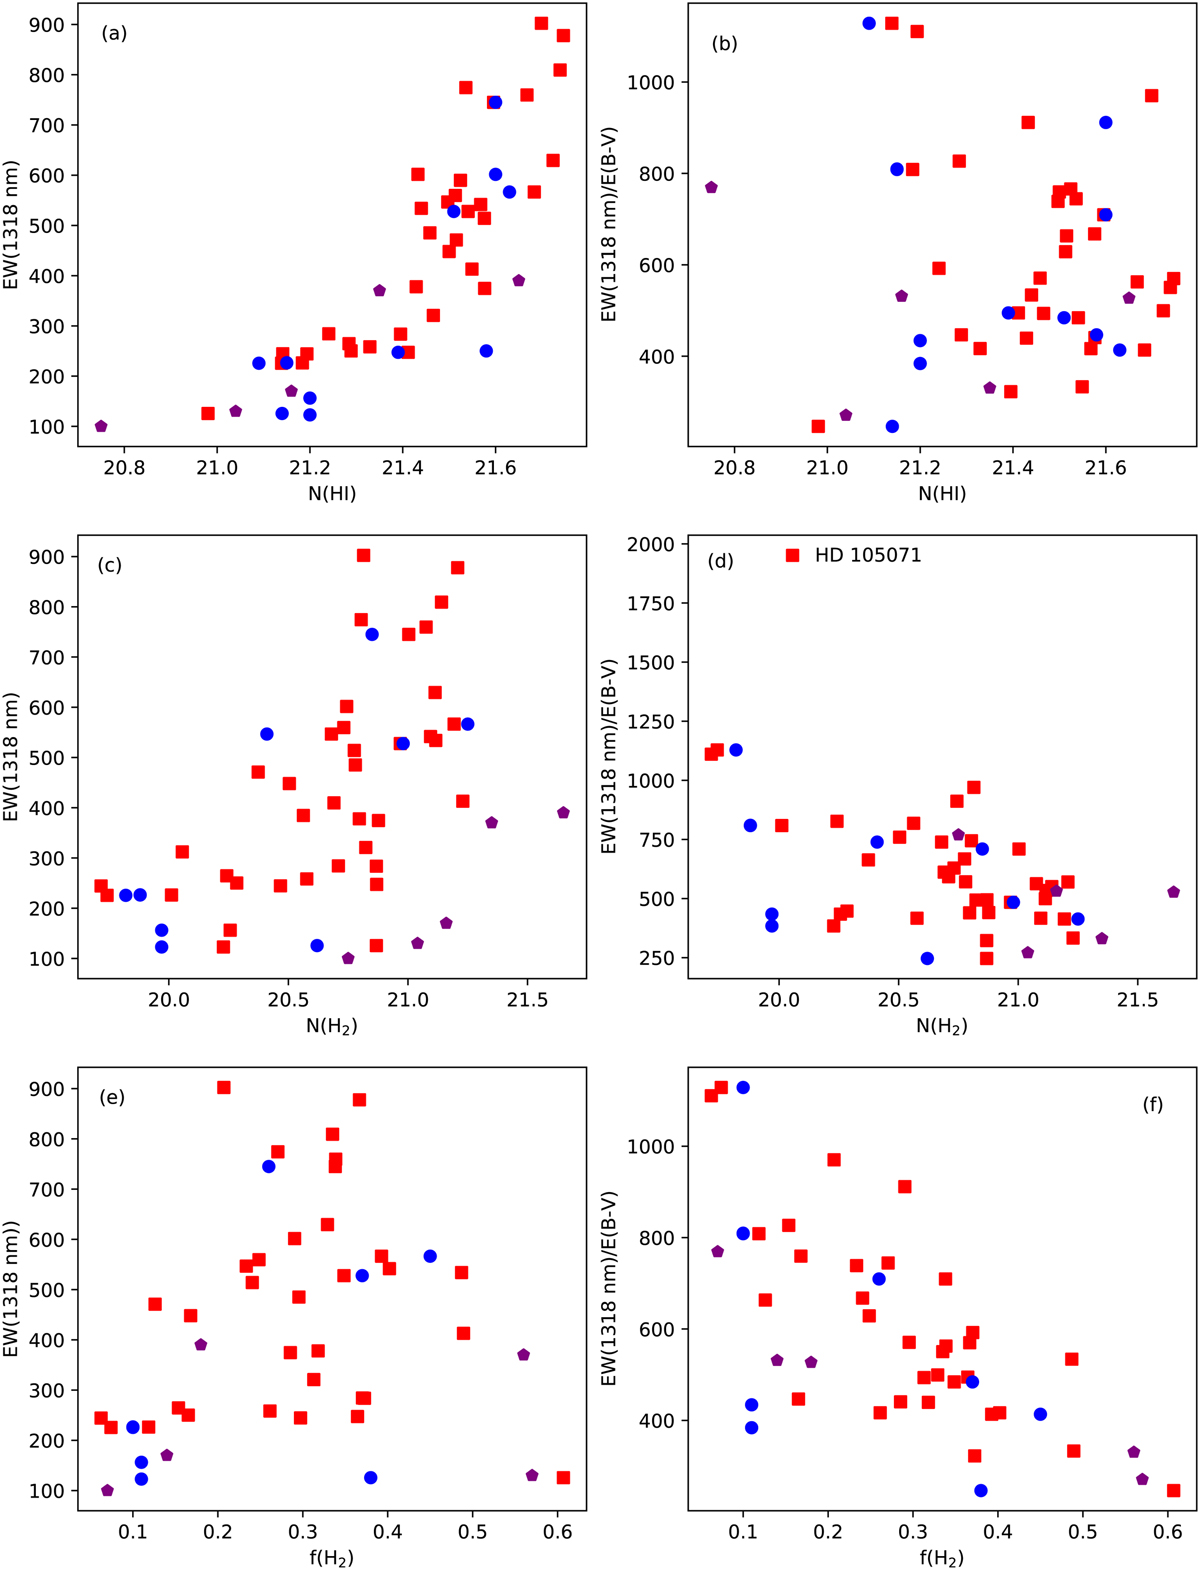
Fig. 18
Download original image
EW(1318 nm) (plots a,c,e) or EW(1318 nm)/E(B – V) (plots b,d,f) plotted against N(H I), N(H2) and f(H2). Stars with emission lines near 1318 nm were excluded. Blue circles: CRIRES data with N(H I), N(H2), f(H2) from the literature. Red squares: CRIRES data with H I calculated from the 5780 DIB and N(H2) from CH. Purple pentagons: X-shooter with N(H I), N(H2), f(H2) from the literature. Outlier HD 105071 is labelled.
Current usage metrics show cumulative count of Article Views (full-text article views including HTML views, PDF and ePub downloads, according to the available data) and Abstracts Views on Vision4Press platform.
Data correspond to usage on the plateform after 2015. The current usage metrics is available 48-96 hours after online publication and is updated daily on week days.
Initial download of the metrics may take a while.