Fig. 14
Download original image
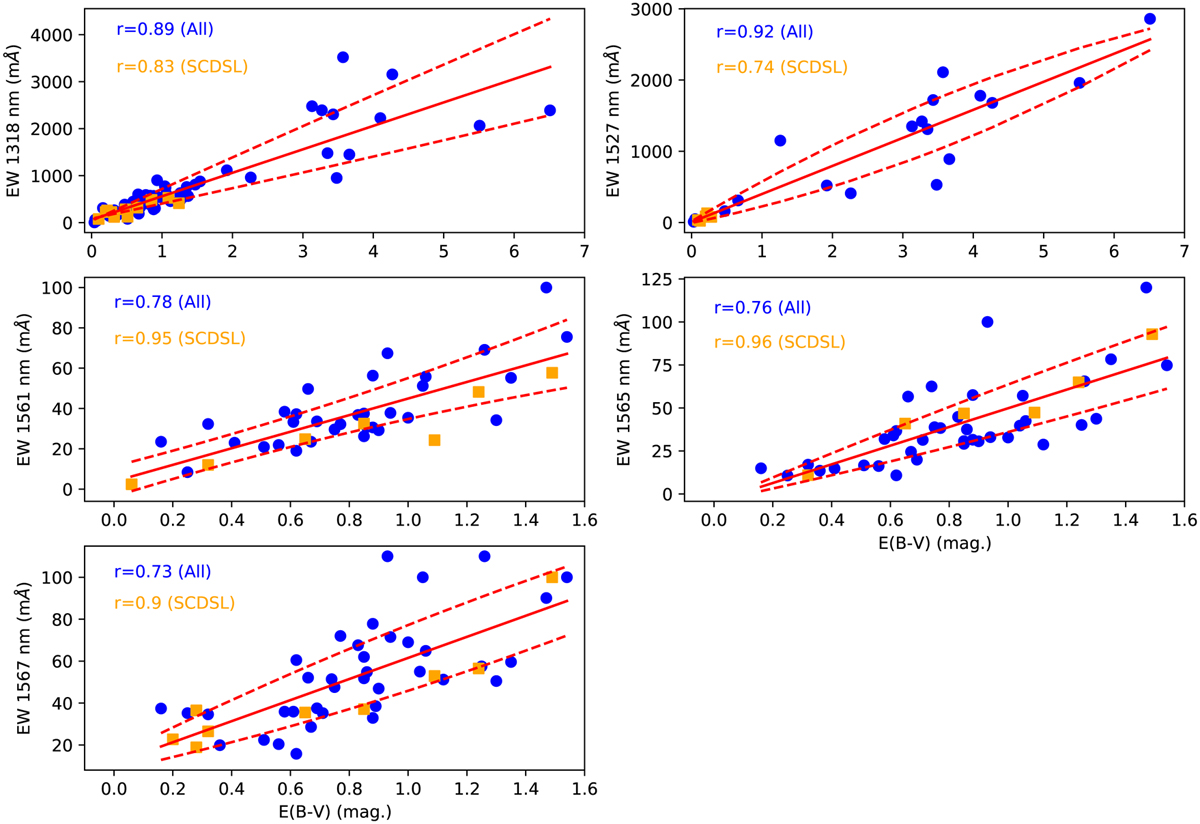
EW in mÅ vs. Reddening E(B – V) (mag.) for the NIR DIBs in the current sample. Blue points show all of the data, and orange points show only single component dominated sightlines. For the 1318 and 1527 nm DIBs for reddening exceeding 3.13 mag. the data are from the X-shooter Cepheid sample that suffer from stellar contamination of around 500 mÅ for un-reddened sightlines. The solid red line is the best fit y=mx+c and the dashed red curves show the upper and lower one sigma error bounds.
Current usage metrics show cumulative count of Article Views (full-text article views including HTML views, PDF and ePub downloads, according to the available data) and Abstracts Views on Vision4Press platform.
Data correspond to usage on the plateform after 2015. The current usage metrics is available 48-96 hours after online publication and is updated daily on week days.
Initial download of the metrics may take a while.