Fig. 13
Download original image
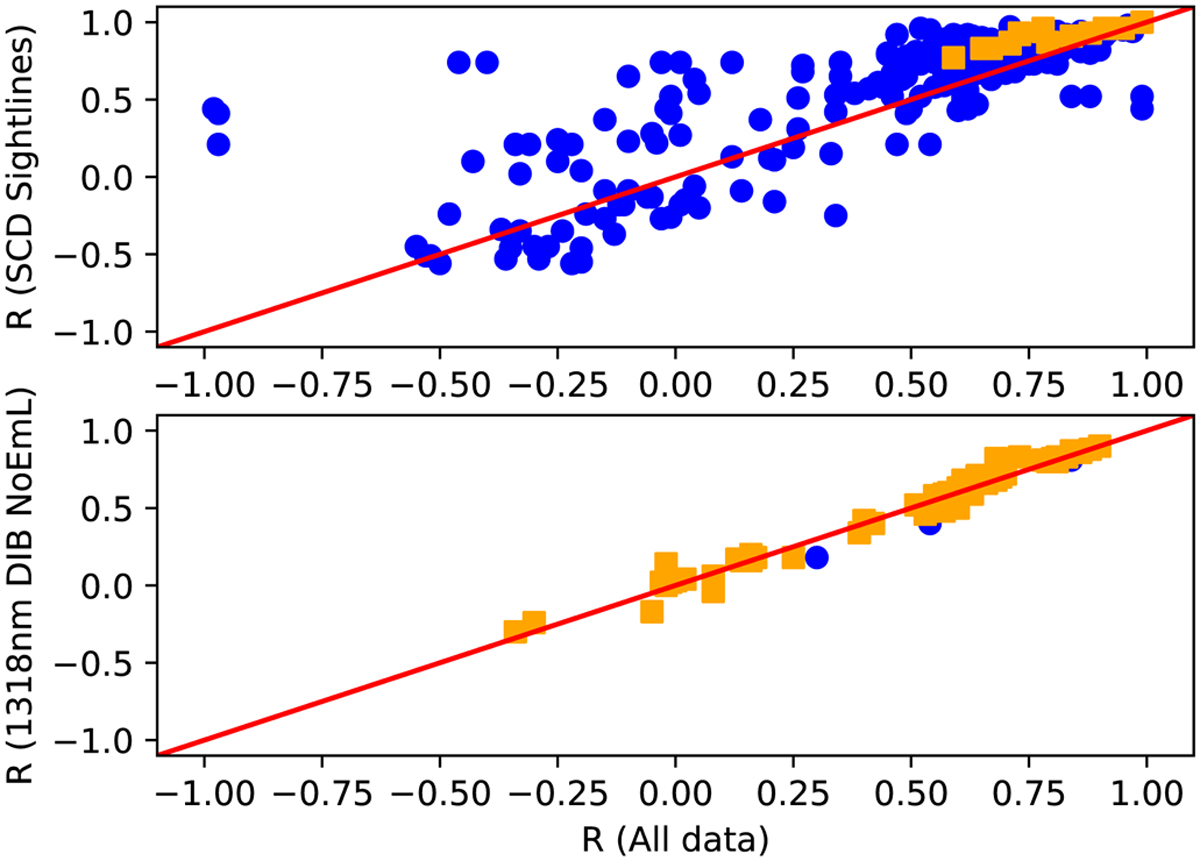
Top panel: Comparison of correlation coefficients derived using the whole sample (abscissa) with those determined for the single component dominated sightlines (ordinate). There is a tendency for the correlation coefficients for the SCDs to be higher. The stars that we consider to be SCD from their K I profiles are HD numbers 36861, 36862, 88661, 89587, 93576, 137753, 144217, 145501, 145502, 147932, 148184, 156738, 164438, 164865, 167264, 169454, 188294 and 318014. Blue and orange symbols: Greater than or equal to ten or 15 data points, respectively. Bottom panel: Correlation coefficients comparing the 1318 nm sample excluding emission-line stars with the whole sample.
Current usage metrics show cumulative count of Article Views (full-text article views including HTML views, PDF and ePub downloads, according to the available data) and Abstracts Views on Vision4Press platform.
Data correspond to usage on the plateform after 2015. The current usage metrics is available 48-96 hours after online publication and is updated daily on week days.
Initial download of the metrics may take a while.