Fig. 9
Download original image
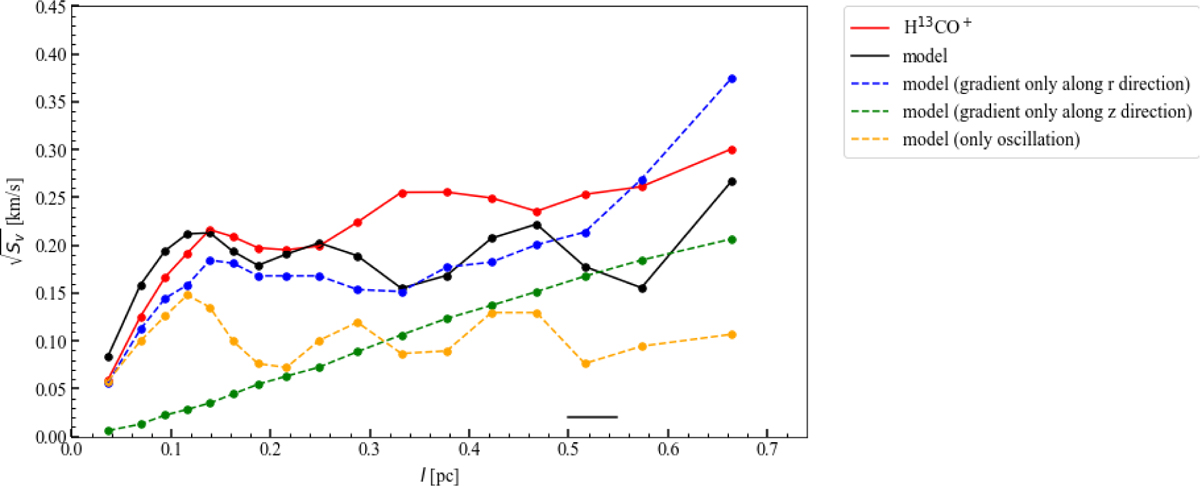
Comparison of the VSF between Nobeyama H13CO+ (1–0) data and the model. The red line and points indicate the VSF of the Nobeyama H13CO+ (1–0) centroid velocity. The black line and points indicate the VSF of the modeled fragmenting filament. Blue, green, and dashed blue lines indicate the VSF of the models in which only the velocity gradient along the r direction, the velocity gradient along the z direction, and the oscillation are taken into account, respectively. The typical uncertainty of the observed VSF is 0.08 km s−1.
Current usage metrics show cumulative count of Article Views (full-text article views including HTML views, PDF and ePub downloads, according to the available data) and Abstracts Views on Vision4Press platform.
Data correspond to usage on the plateform after 2015. The current usage metrics is available 48-96 hours after online publication and is updated daily on week days.
Initial download of the metrics may take a while.