Fig. 8
Download original image
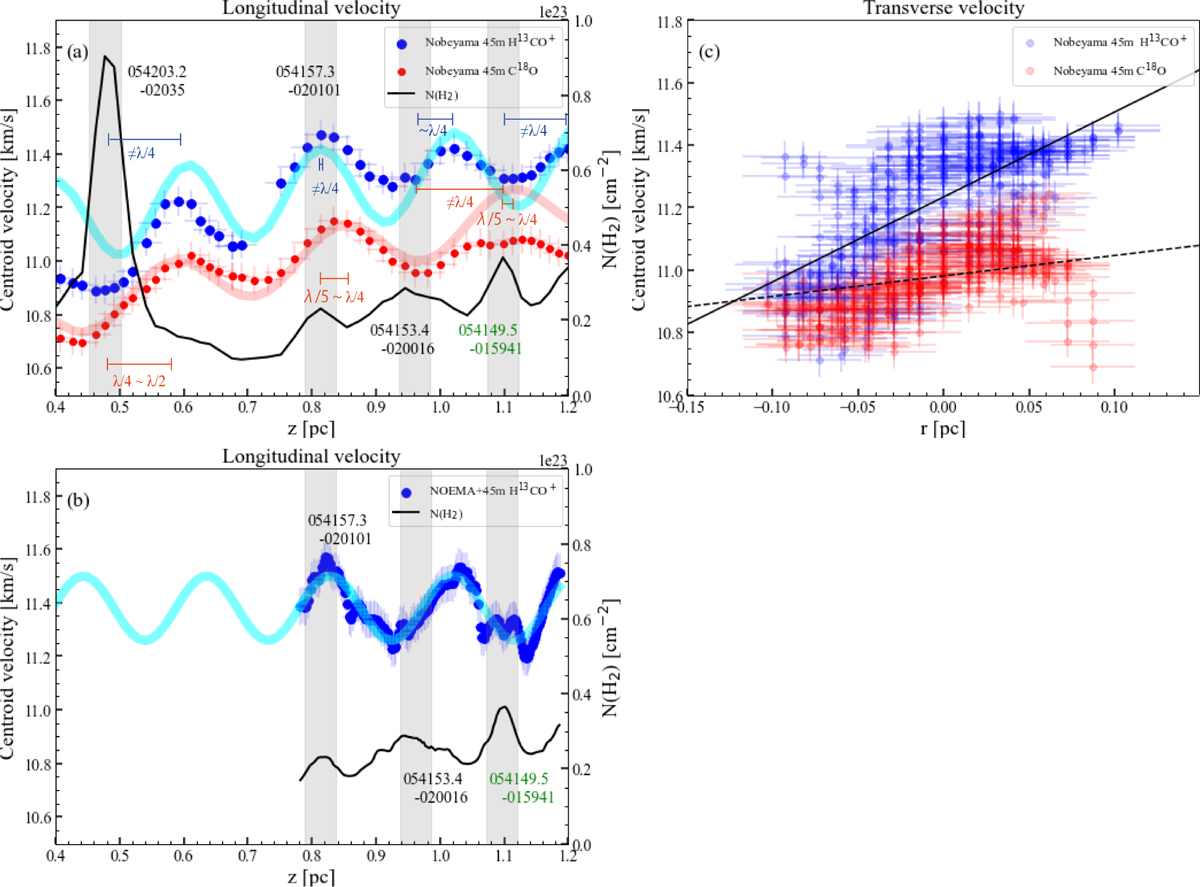
(a) Nobeyama 45m H13CO+ (1–0) and C18O (1–0) centroid velocities along the filament, (b) NOEMA+45m H13CO+ (1–0) centroid velocities along the filament, and (c) Nobeyama 45m H13 CO+ (1–0) and C18O (1–0) centroid velocities along the r direction. In each panel, blue and red points indicate the centroid velocity of H13 CO+ and C18 O, respectively. In panels a and b, the blue and red curves show the result of the least square fitting with a function of υ(z) = Vsys + z∇Vz + V0 cos(2πz/λ + θoffset) against the H13CO+ (1–0) and C18O(1–0) centroid velocity. In panels a and b, the black curves indicate the distribution of Herschel H2 column density along the filament in the 25″ resolution map. The vertical gray strips indicate the positions of Herschel dense cores identified by Könyves et al. (2020, HGBS 054203.2-020235, 054157.3-020101, 054153.4-020016, and 054149.5-015941). The width of each strip corresponds to a 25″ beam. The core labeled in green is associated with a Spitzer protostar (Megeath et al. 2012). In this plot, z measures the position along the magenta curve in Fig. 1, and z = 0 corresponds to the southeastern edge of the curve. Each data point is on the crest of the filament. In panel c, the two solid and dashed lines show the best-fit transverse velocity gradient of the form V(r) = Vsys + r∇Vr observed in H13CO+ (1–0) and C18O (1–0), respectively. r = 0 corresponds to the crest of the filament as indicated by the magenta curve in Fig. 1. All pixels in the maps of Figs. 7a, b, and d are used for this plot by estimating the projected separation from the filament crest.
Current usage metrics show cumulative count of Article Views (full-text article views including HTML views, PDF and ePub downloads, according to the available data) and Abstracts Views on Vision4Press platform.
Data correspond to usage on the plateform after 2015. The current usage metrics is available 48-96 hours after online publication and is updated daily on week days.
Initial download of the metrics may take a while.