Fig. 7
Download original image
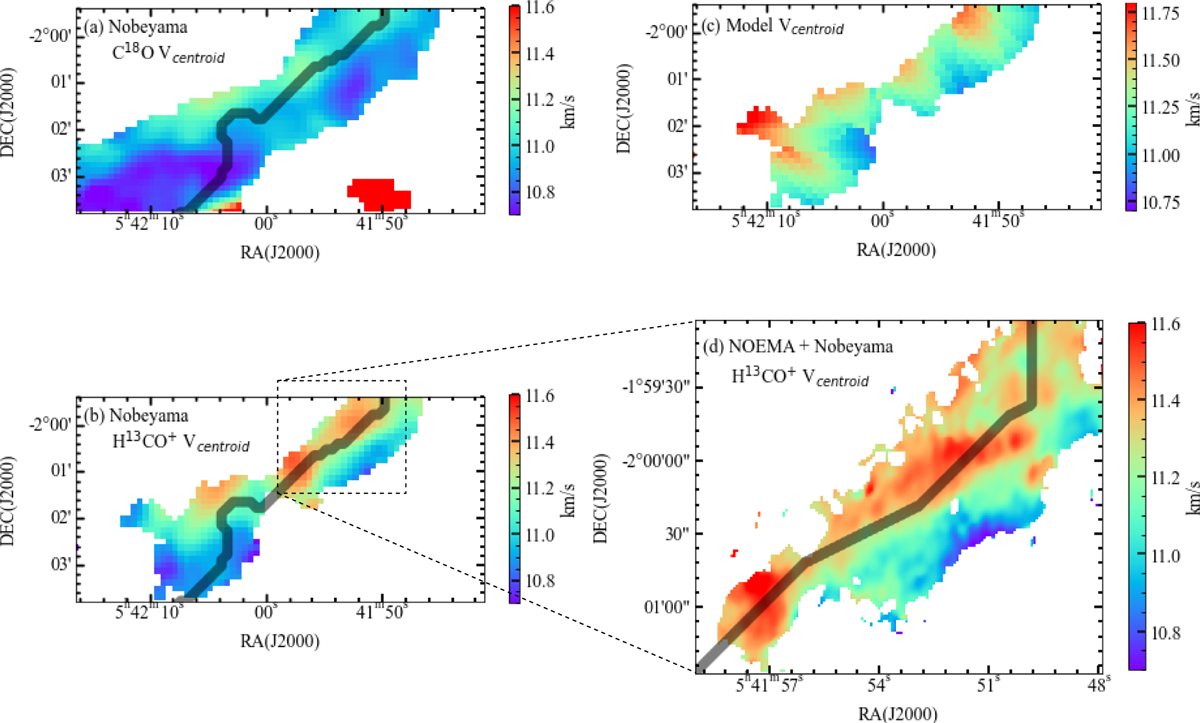
(a) Nobeyama C18O (1–0) centroid velocity map, (b) Nobeyama H13CO+ (1–0) centroid velocity map (close-up view of panel b in Fig. 4), (c) centroid velocity map of the fragmenting filament model, and (d) NOEMA+45m H13 CO+ (1–0) centroid velocity map toward the NOEMA observed area indicated by the dashed box in panel b. In panels a and b, a black line indicates the crest of the filament which corresponds to the z-axis in Fig. 8a and r = 0 in Fig. 8b. The back line starts at (RAJ2000, DecJ2000)=(5h42m11s.823, −2°02m53s.97) and ends at (RAJ2000, DecJ2000)=(5h41m45s.806, −1°59m23s.97). See also Fig. A.1.
Current usage metrics show cumulative count of Article Views (full-text article views including HTML views, PDF and ePub downloads, according to the available data) and Abstracts Views on Vision4Press platform.
Data correspond to usage on the plateform after 2015. The current usage metrics is available 48-96 hours after online publication and is updated daily on week days.
Initial download of the metrics may take a while.