Fig. 6
Download original image
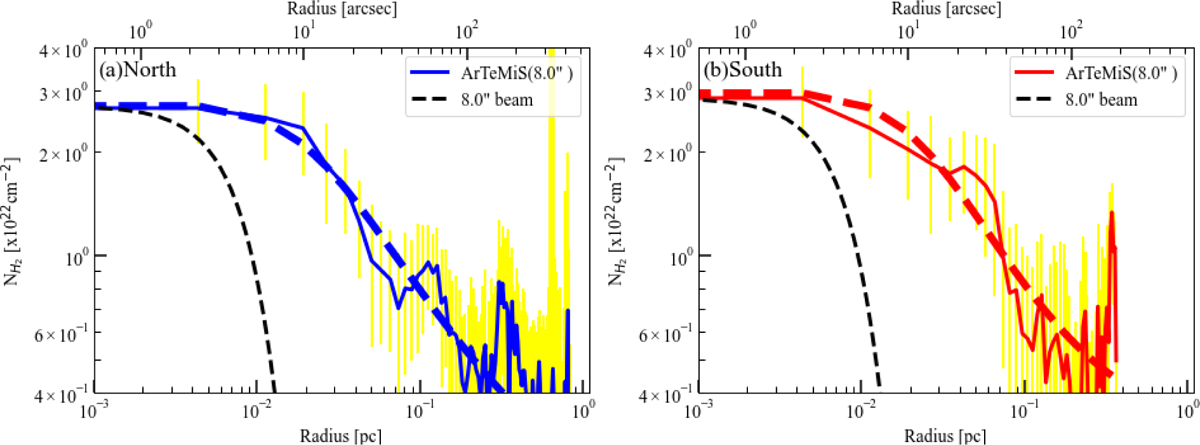
Median radial ArTéMiS+Herschel column density profiles for the (a) northeastern and (b) southwestern side of the NGC 2024S filament. The defined crest of the filament is shown in Fig. B.1. The dashed black curves indicate the angular resolution of the ArTeMiS+Herschel column density map (8″). The dashed curves show the best-fit Plummer mode. The yellow bars show the dispersion (±1σ) of the distribution of radial profiles along the filament. The area affected by the secondary component seen in the NOEMA H13CO+ data was avoided when producing the median radial profile for the southwestern side of the NGC 2024S filament (see Sect. 3.1.3).
Current usage metrics show cumulative count of Article Views (full-text article views including HTML views, PDF and ePub downloads, according to the available data) and Abstracts Views on Vision4Press platform.
Data correspond to usage on the plateform after 2015. The current usage metrics is available 48-96 hours after online publication and is updated daily on week days.
Initial download of the metrics may take a while.