Fig. 4
Download original image
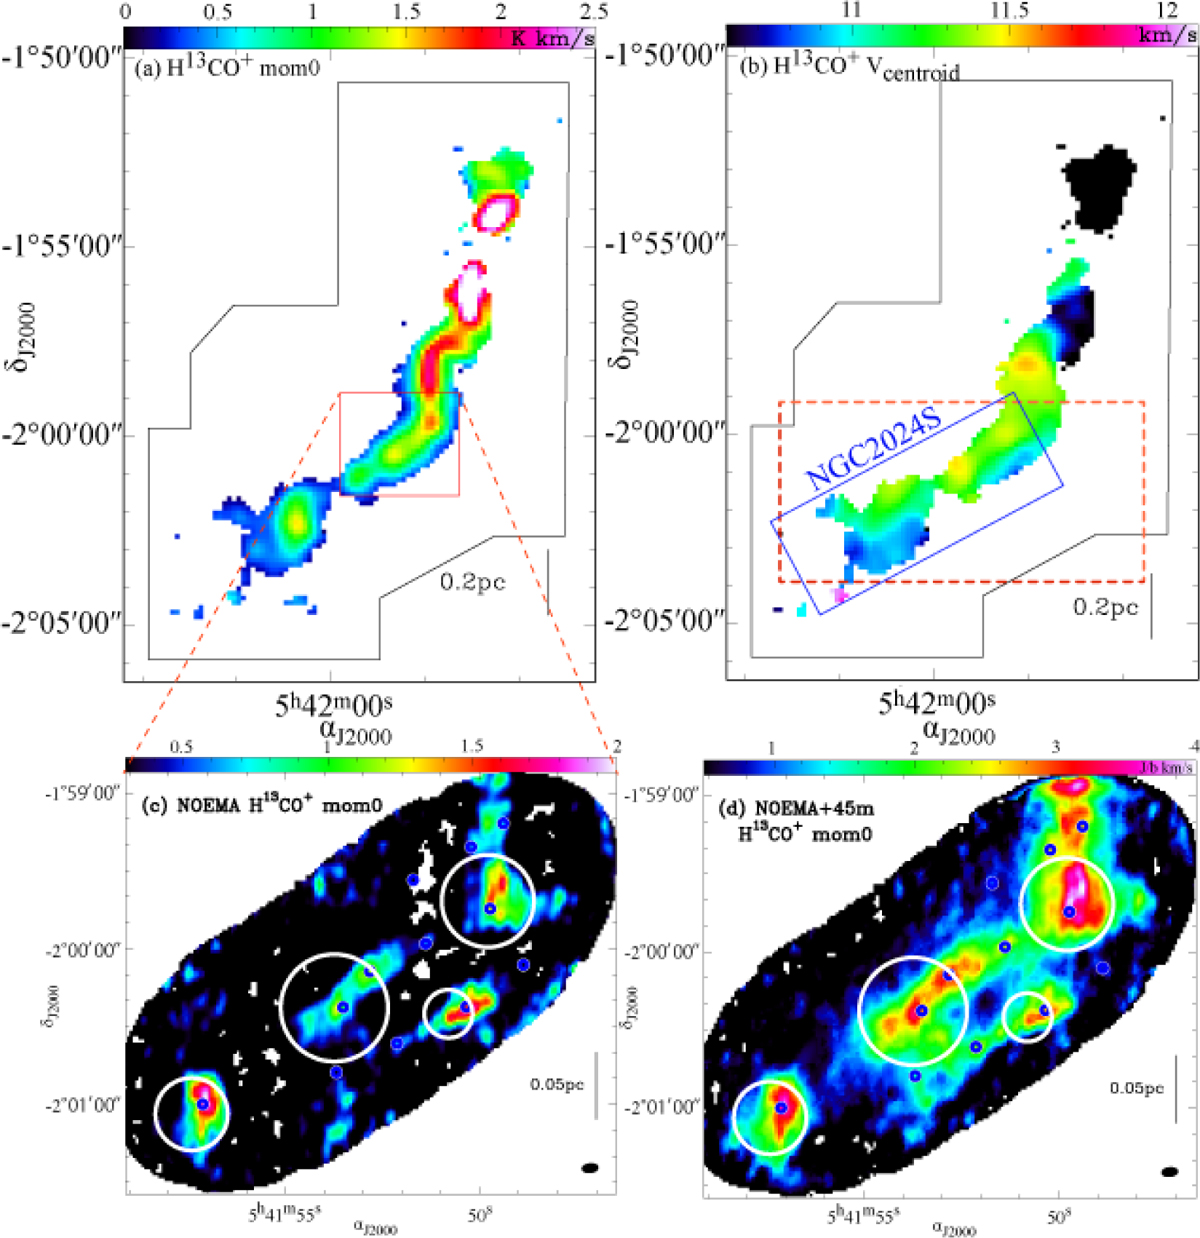
(a) Nobeyama 45m H13CO+ (1–0) integrated intensity, (b) H13CO+ (1–0) centroid velocity map, (c) NOEMA, and (d) NOEMA+45m H13CO+ (1–0) integrated intensity maps. The integrated velocity range is from 10.21 km s−1 to 11.96 km s−1. In panels a and b, black polygons outline the field observed in the H13CO+ (1–0) line. In panel a, the red box indicates the area shown in panels c and d. In panel b, the dashed red box indicates the area shown in Fig. 7. The white open circles in panels c and d indicate the positions of the cores identified in the Herschel map via the dendrogram analysis. The sizes of the white open circles reflect the Herschel source sizes. The small blue open circles in panels c and d mark the positions of the cores identified in the NOEMA H13CO+ map via the dendrogram analysis with a fixed symbol size. The filled circles at the bottom right indicate the beam sizes in panels a and b. See also Fig. A.1.
Current usage metrics show cumulative count of Article Views (full-text article views including HTML views, PDF and ePub downloads, according to the available data) and Abstracts Views on Vision4Press platform.
Data correspond to usage on the plateform after 2015. The current usage metrics is available 48-96 hours after online publication and is updated daily on week days.
Initial download of the metrics may take a while.