Fig. 3
Download original image
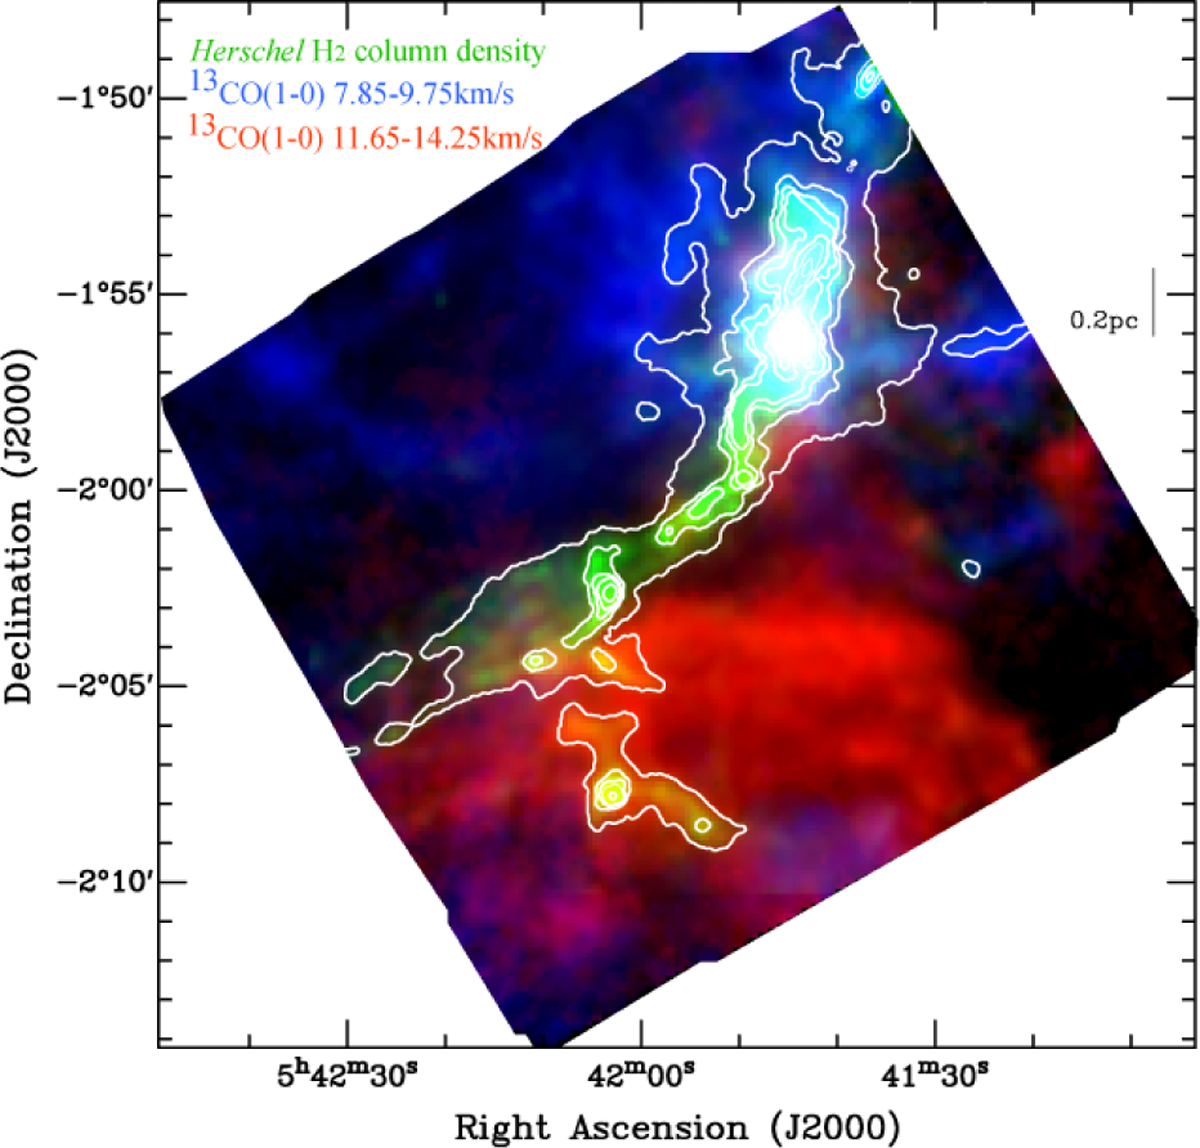
Three-color composite image of the Herschel H2 column density map (green) and the blueshifted and redshifted Nobeyama 13CO emission (red: 7.85–9.75 km s−1 and blue: 11.65–14.25 km s−1; see also Figs. 2g and i). The white contours correspond to Ay levels of 8, 16, 24, 32, 64, 128, and 256mag (assuming ![]() ; Bohlin et al. 1978) in the Herschel H2 column density map at an angular resolution of 18″.2.
; Bohlin et al. 1978) in the Herschel H2 column density map at an angular resolution of 18″.2.
Current usage metrics show cumulative count of Article Views (full-text article views including HTML views, PDF and ePub downloads, according to the available data) and Abstracts Views on Vision4Press platform.
Data correspond to usage on the plateform after 2015. The current usage metrics is available 48-96 hours after online publication and is updated daily on week days.
Initial download of the metrics may take a while.