Fig. A.4
Download original image
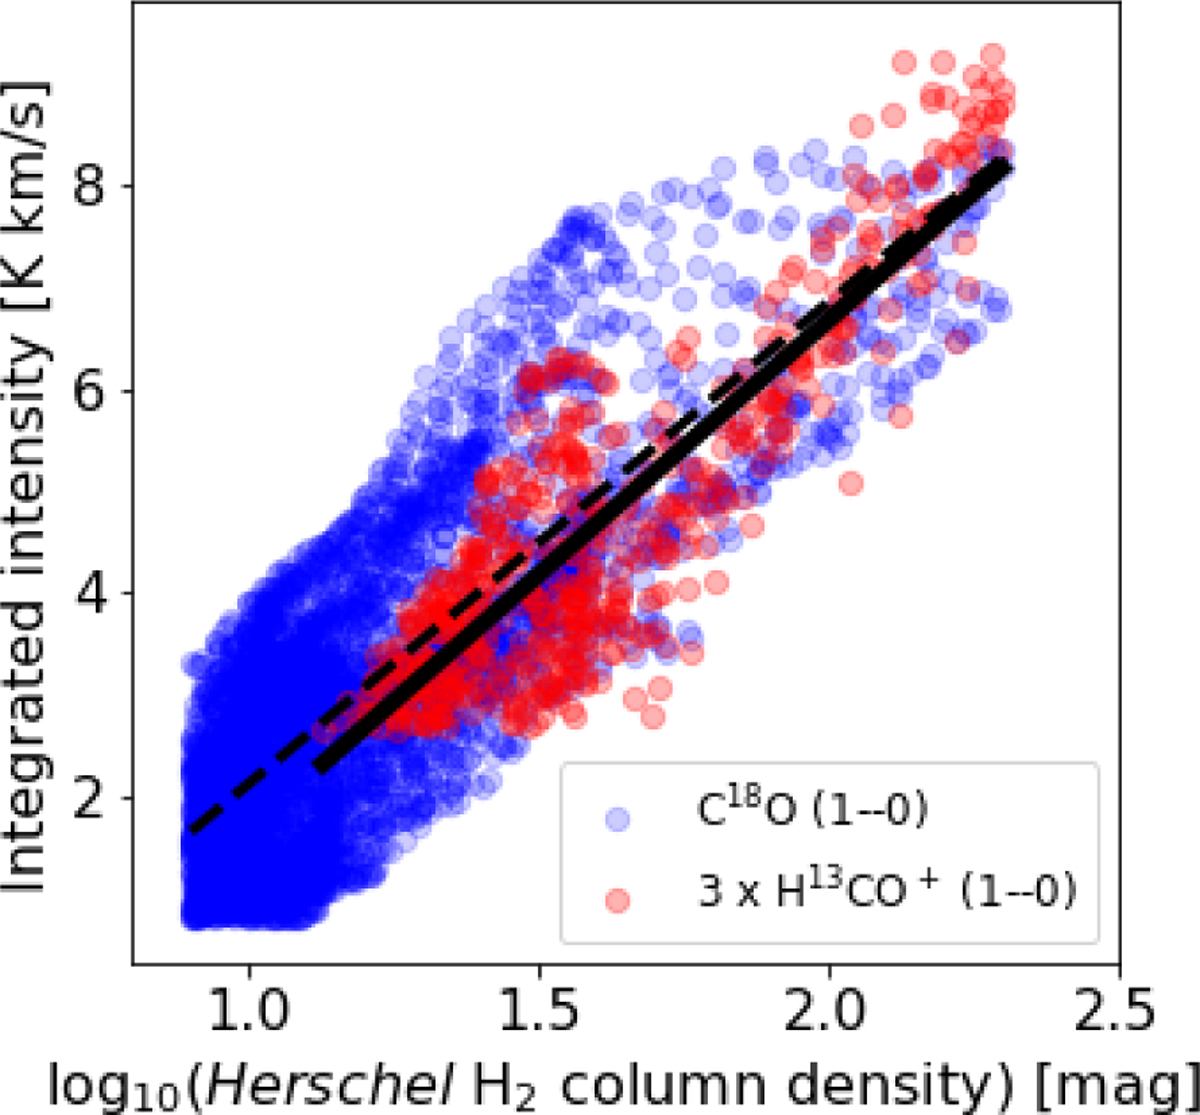
Pixel-to-pixel correlation between H13CO+ (1–0) and C18O (1–0) integrated intensities in K km s−1 and Herschel H2 column density in mag (assuming ![]() , Bohlin et al. 1978). The blue and red points indicate the correlation between C18O (1–0) integrated intensity and Herschel H2 column density and between H13CO+ (1–0) integrated intensity and Herschel H2 column density, respectively. The dashed and solid lines indicate the best-fit result for the C18O - Herschel H2 column density correlation and for the H13CO+ - Herschel H2 column density correlation.
, Bohlin et al. 1978). The blue and red points indicate the correlation between C18O (1–0) integrated intensity and Herschel H2 column density and between H13CO+ (1–0) integrated intensity and Herschel H2 column density, respectively. The dashed and solid lines indicate the best-fit result for the C18O - Herschel H2 column density correlation and for the H13CO+ - Herschel H2 column density correlation.
Current usage metrics show cumulative count of Article Views (full-text article views including HTML views, PDF and ePub downloads, according to the available data) and Abstracts Views on Vision4Press platform.
Data correspond to usage on the plateform after 2015. The current usage metrics is available 48-96 hours after online publication and is updated daily on week days.
Initial download of the metrics may take a while.