Fig. A.3
Download original image
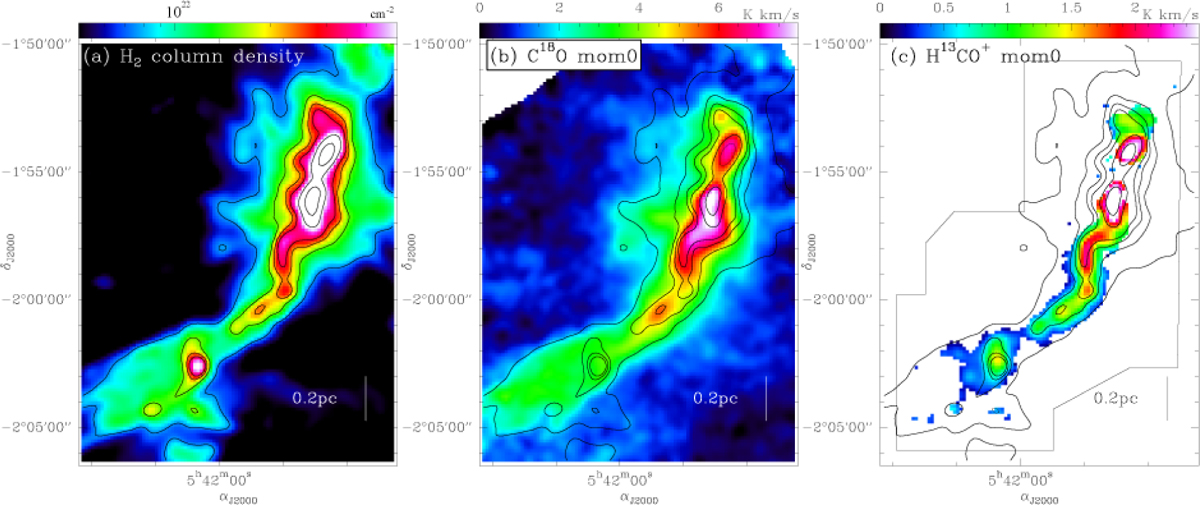
Comparison of (a) Herschel H2 column density, (b) Nobeyama 45m C18O integrated intensity, and (c) Nobeyama 45m H13CO+ (1–0) integrated intensity maps with an angular resolution of 30″. Panel a is the same as Fig. 1, but the angular resolution is smoothed to be 30″. Panel b is the same as Fig. 2m, but the angular resolution is smoothed to be 30″. Panel c is the same as Fig. 4b. The black contours in each panel indicate the AV column density levels of 8, 16, 24, 32, 64, 128, and 256 mag (assuming ![]() ; Bohlin et al. 1978).
; Bohlin et al. 1978).
Current usage metrics show cumulative count of Article Views (full-text article views including HTML views, PDF and ePub downloads, according to the available data) and Abstracts Views on Vision4Press platform.
Data correspond to usage on the plateform after 2015. The current usage metrics is available 48-96 hours after online publication and is updated daily on week days.
Initial download of the metrics may take a while.