Open Access
Fig. A.2
Download original image
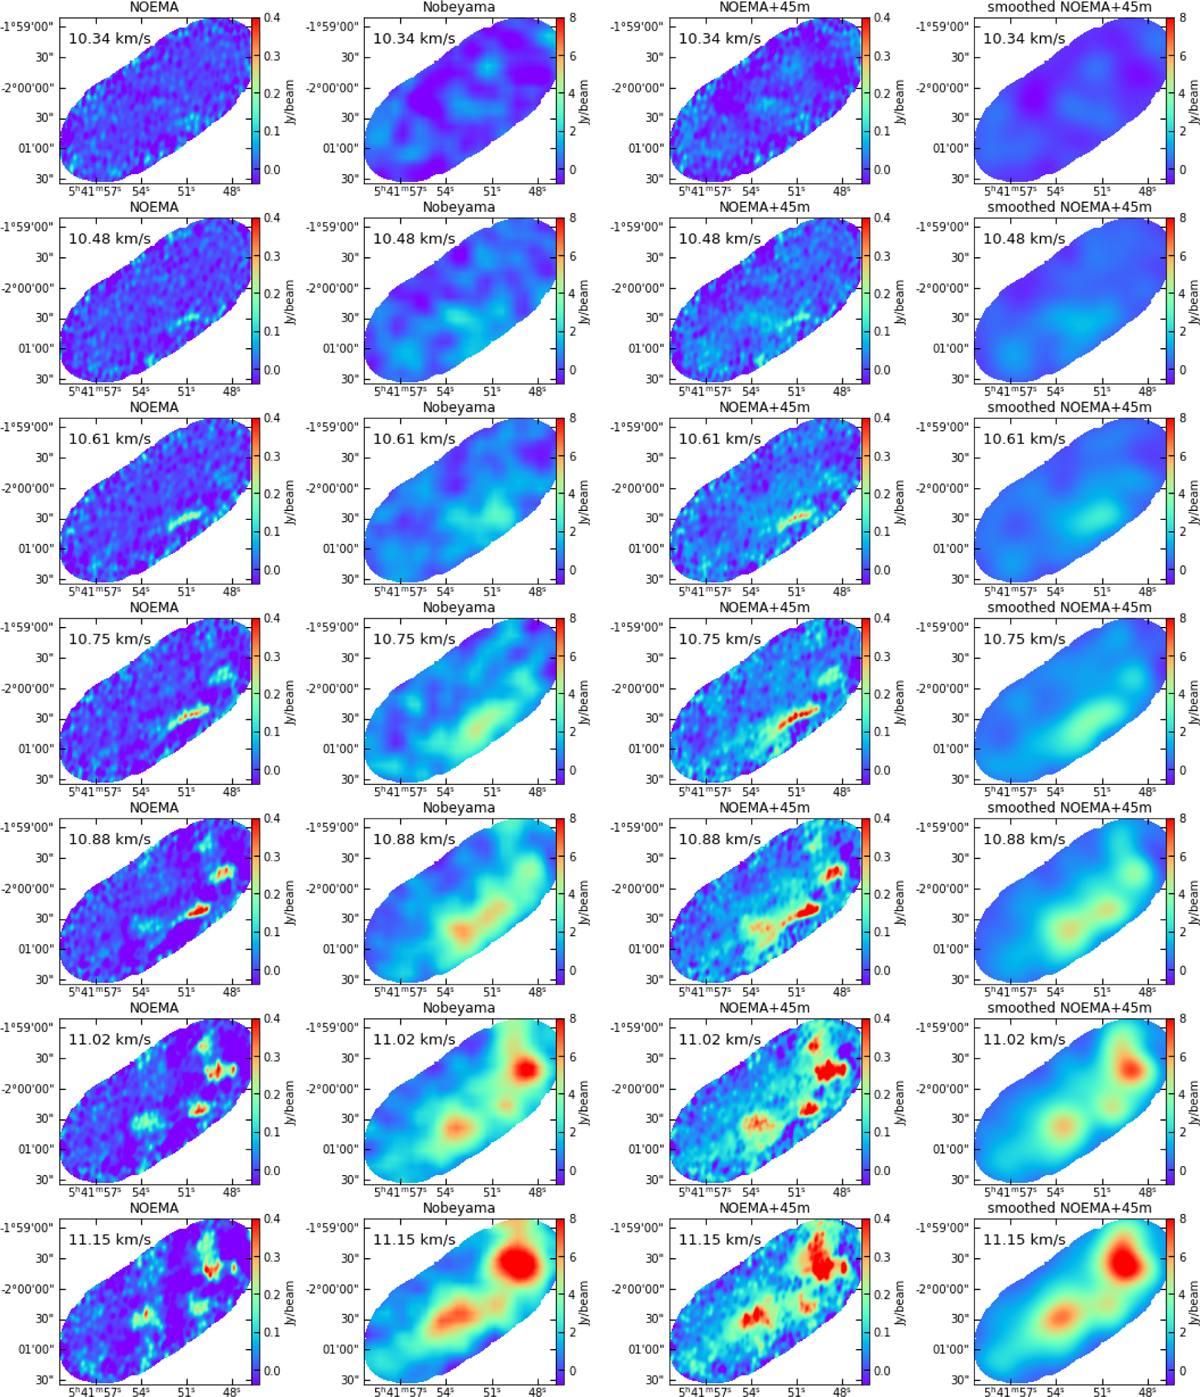
Comparison of the velocity channel maps of NOEMA H13CO+(1–0) data (first column), Nobeyama H13CO+(1–0) data (second column), NOEMA+45m data (third column), and smoothed NOEMA+45m data (fourth column). The velocity is indicated at the top left of each panel.
This figure is made of several images, please see below:
Current usage metrics show cumulative count of Article Views (full-text article views including HTML views, PDF and ePub downloads, according to the available data) and Abstracts Views on Vision4Press platform.
Data correspond to usage on the plateform after 2015. The current usage metrics is available 48-96 hours after online publication and is updated daily on week days.
Initial download of the metrics may take a while.