Open Access
Fig. A.1
Download original image
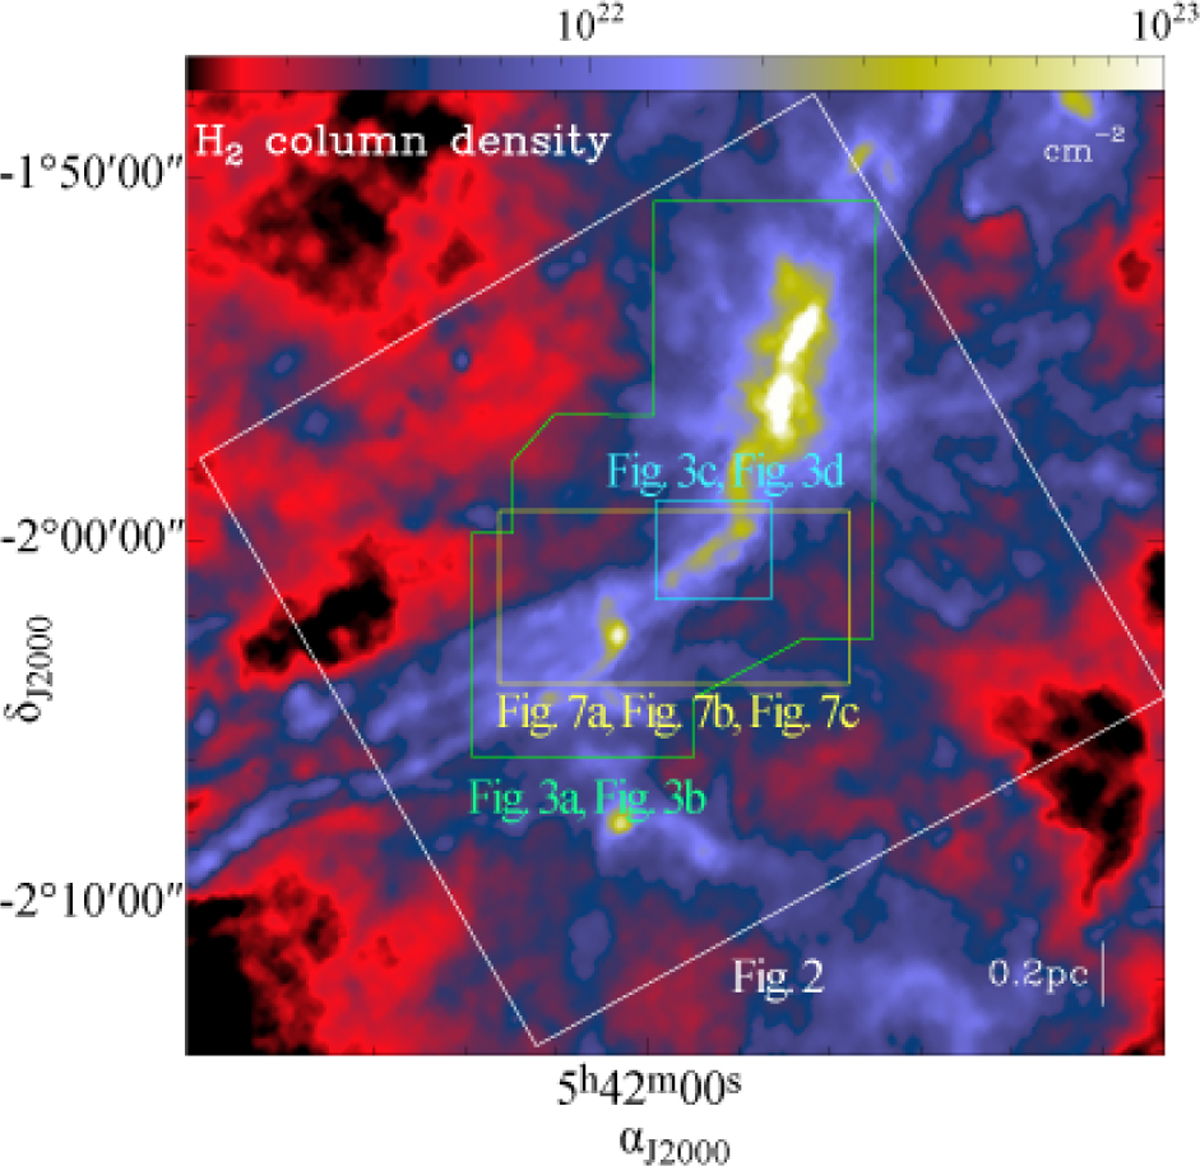
Herschel column density map, with the area of each figure indicated. A white box indicates the area shown in Fig. 2. A green polygon indicates the area shown in Fig. 4a and Fig. 4b. A yellow box indicates the area shown in Fig. 7a, Fig. 7b, and Fig. 7c. A cyan box indicates the area shown in Fig. 4c and Fig. 4d.
Current usage metrics show cumulative count of Article Views (full-text article views including HTML views, PDF and ePub downloads, according to the available data) and Abstracts Views on Vision4Press platform.
Data correspond to usage on the plateform after 2015. The current usage metrics is available 48-96 hours after online publication and is updated daily on week days.
Initial download of the metrics may take a while.