Fig. 10
Download original image
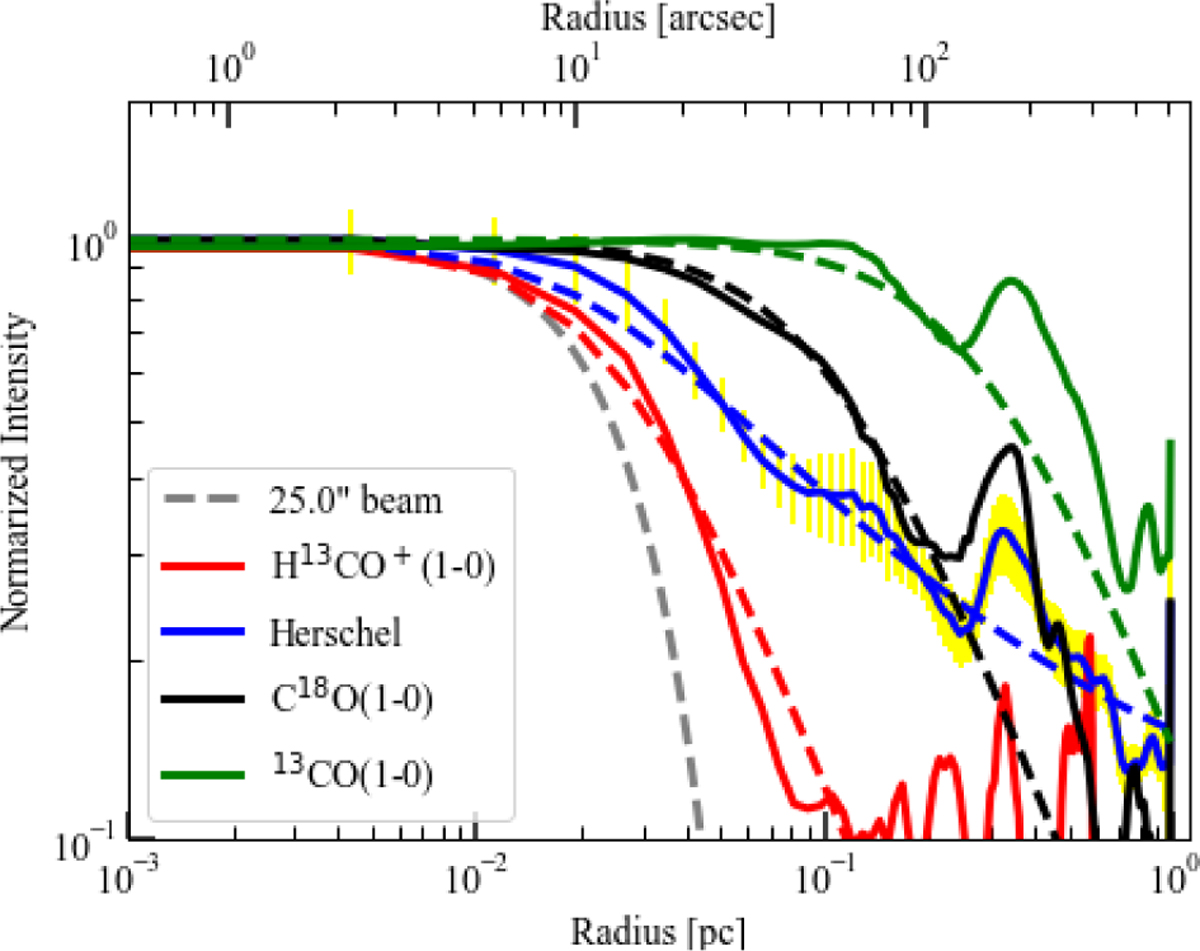
Comparison of median radial column density profiles for the northeastern side of the NGC 2024S filament among Herschel column density (blue), H13CO+ (red), C18O (black), and 13CO (green) at a resolution of 25″ (~0.048 pc). The dashed curves show the best-fit Plummer model. The yellow bars show the dispersion (±1σ) of the distribution of the radial profile along the filament in Herschel. The gray curves indicate the angular resolution of 25″. Note that we reproduced the Nobeyama H13CO+ map with an angular resolution of 25″ to compare it with others in the same angular resolution.
Current usage metrics show cumulative count of Article Views (full-text article views including HTML views, PDF and ePub downloads, according to the available data) and Abstracts Views on Vision4Press platform.
Data correspond to usage on the plateform after 2015. The current usage metrics is available 48-96 hours after online publication and is updated daily on week days.
Initial download of the metrics may take a while.