Fig. 1
Download original image
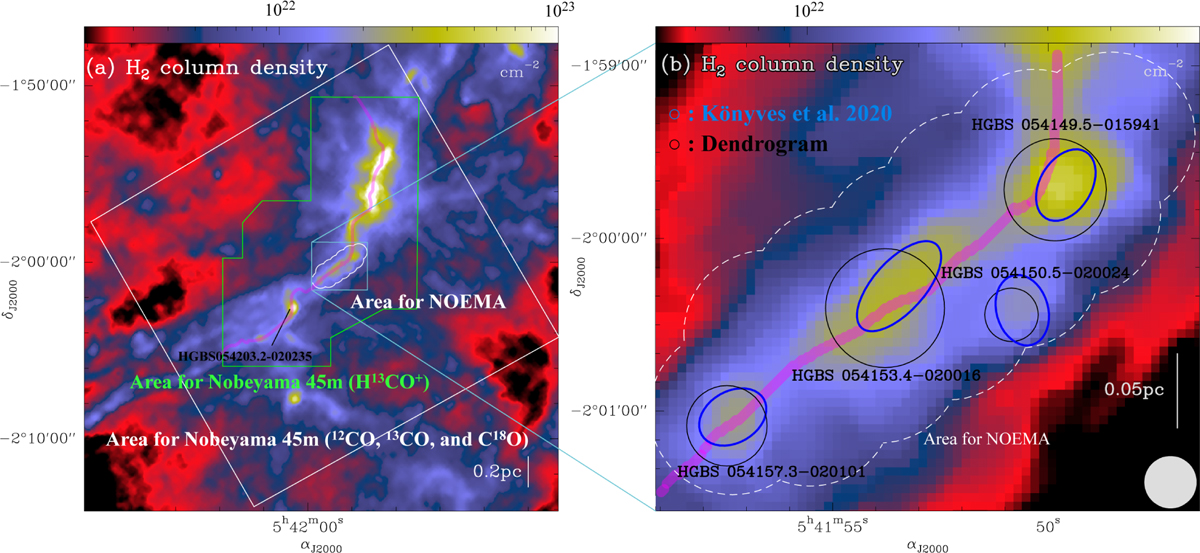
Herschel column density map at an angular resolution of 18″.2 toward the NGC 2024 region (a) and toward the area observed with the NOEMA interferometer (b). The Herschel column density map is from HGBS data (Könyves et al. 2020). In both panels, the magenta curve indicates the filament crest. The filament crest is determined by the DisPerSE algorithm (Sousbie 2011; Sousbie et al. 2011; Arzoumanian et al. 2011). In panel (a), the white box indicates the field observed in the 12CO (1–0), 13CO (1–0), and C18O (1–0) lines with the Nobeyama 45m telescope. The green polygon outlines the field observed in H13CO+ (1–0). The dashed white circles indicate the field of view of the NOEMA mosaic observations. In panel (b), the blue open ellipses mark the cores identified by Könyves et al. (2020) and the black open circles the cores identified in the Herschel map via the dendrogram analysis. The sizes of the ellipses and circles reflect the core sizes estimated by Könyves et al. (2020) and from the dendrogram analysis, respectively.
Current usage metrics show cumulative count of Article Views (full-text article views including HTML views, PDF and ePub downloads, according to the available data) and Abstracts Views on Vision4Press platform.
Data correspond to usage on the plateform after 2015. The current usage metrics is available 48-96 hours after online publication and is updated daily on week days.
Initial download of the metrics may take a while.