Fig. 4.
Download original image
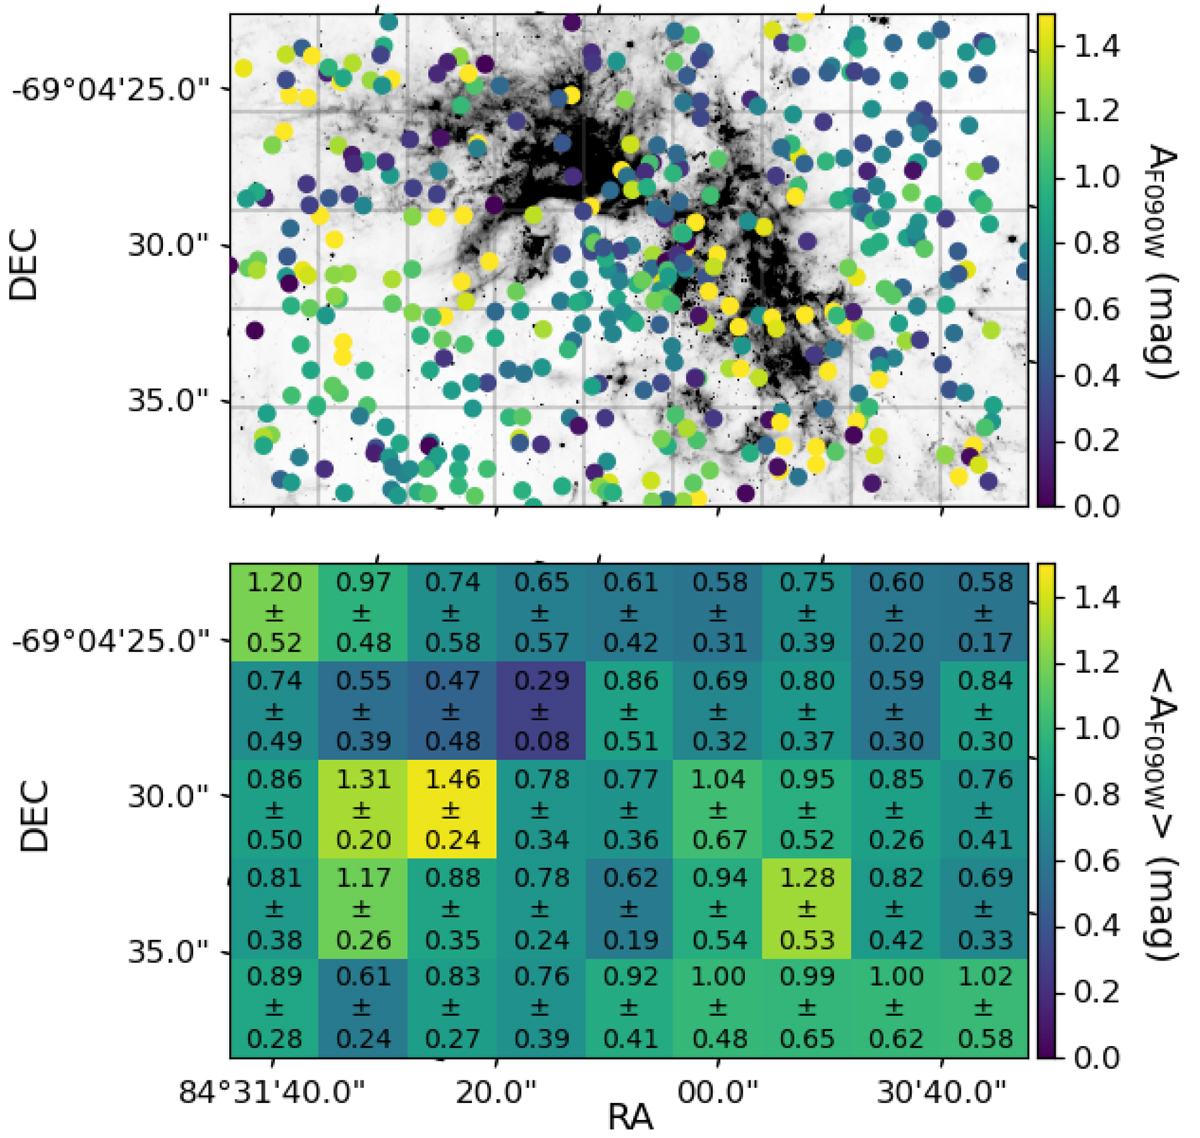
Extinction map. Top: F335M mosaic of 30 Doradus (greyscale image) with individual RC stars (dots, colour-coded by their F090W extinction). Bottom: average F090W extinction in a grid of the same field-of-view. The mean extinction and the standard deviation are given by the number in each cell. The number of stars in each cell ranges from 5 to 28.
Current usage metrics show cumulative count of Article Views (full-text article views including HTML views, PDF and ePub downloads, according to the available data) and Abstracts Views on Vision4Press platform.
Data correspond to usage on the plateform after 2015. The current usage metrics is available 48-96 hours after online publication and is updated daily on week days.
Initial download of the metrics may take a while.