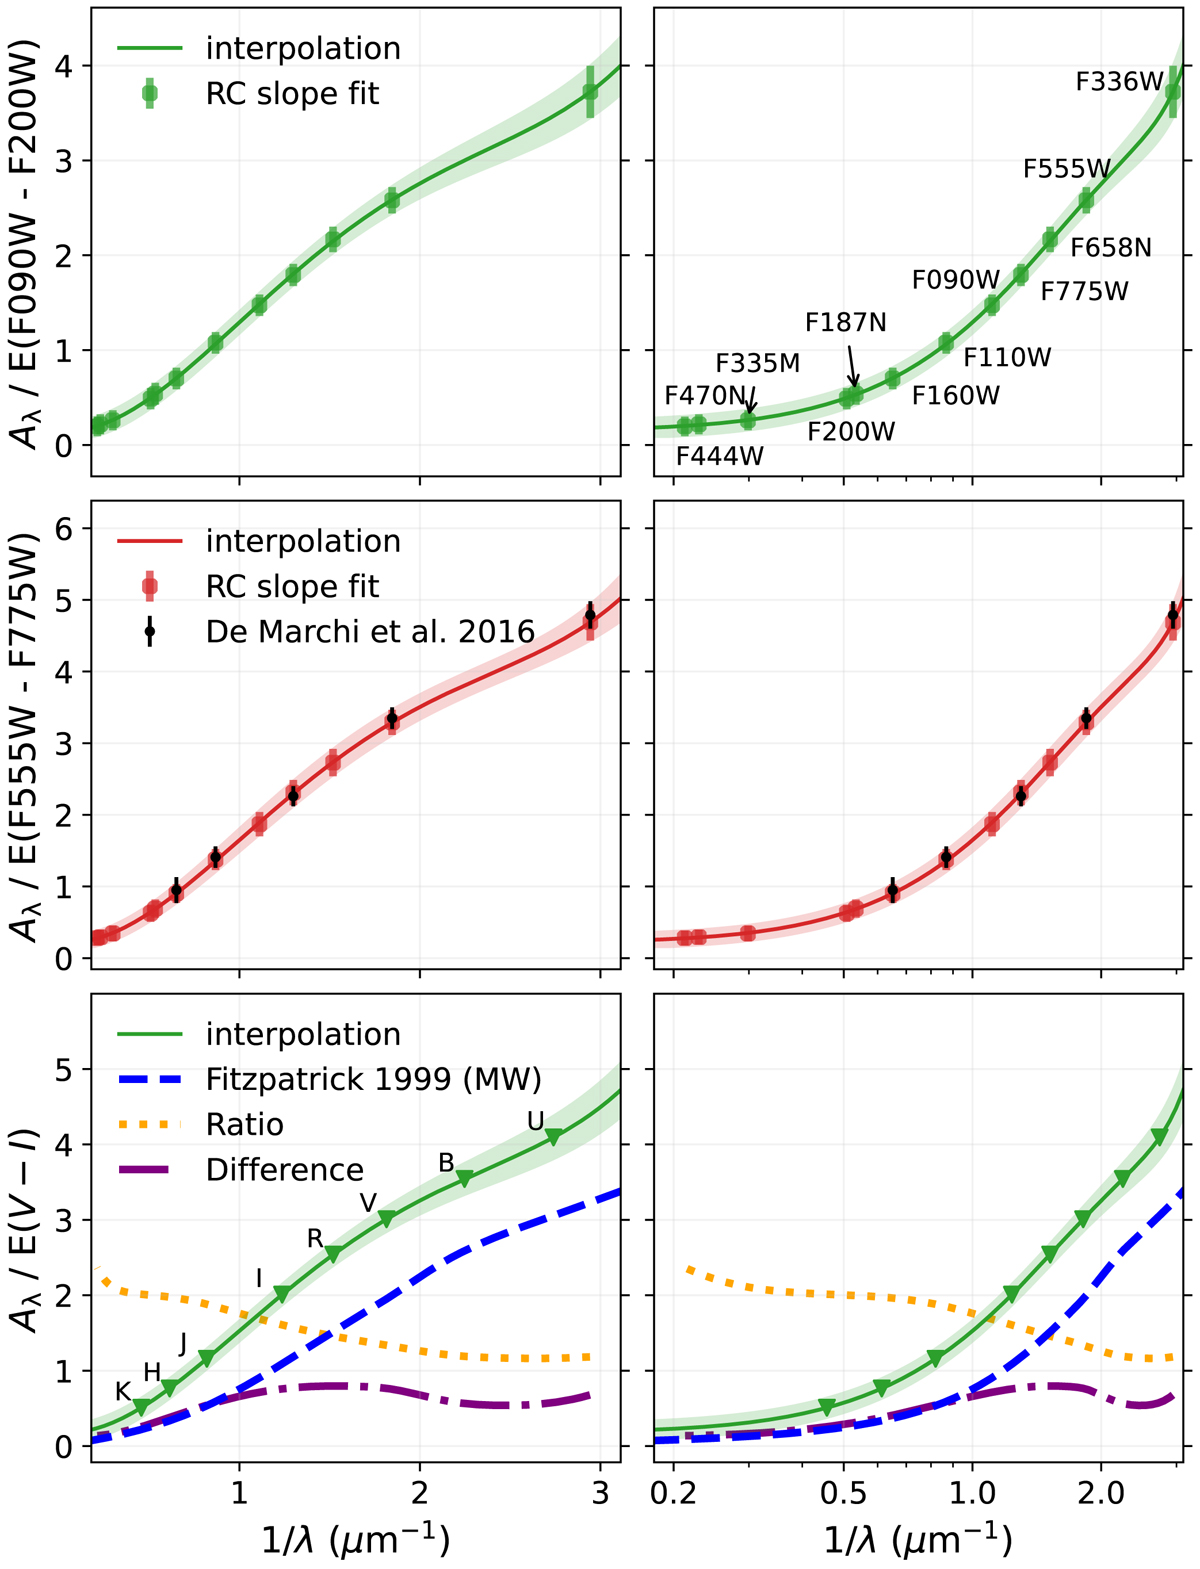
Fig. 3.
Download original image
Extinction law with linear (left) and logarithmic (right) x-axis. Top: green dots show the measured slopes of the RC stars using the F090W – F200W JWST colour. The solid line shows a univariate spline interpolation. Middle: red dots show the extinction curve as a function of F555W – F775W colours with results from De Marchi et al. (2016) (black dots) for optical wavelengths. Bottom: interpolated results for Aλ/E(V − I), compared to the MW extinction law (Fitzpatrick 1999) with RV = 3.1, corresponding to RV − I(V) = 2.3. Ratio and difference between those curves are shown by the orange dotted and purple dash-dotted lines, respectively.
Current usage metrics show cumulative count of Article Views (full-text article views including HTML views, PDF and ePub downloads, according to the available data) and Abstracts Views on Vision4Press platform.
Data correspond to usage on the plateform after 2015. The current usage metrics is available 48-96 hours after online publication and is updated daily on week days.
Initial download of the metrics may take a while.