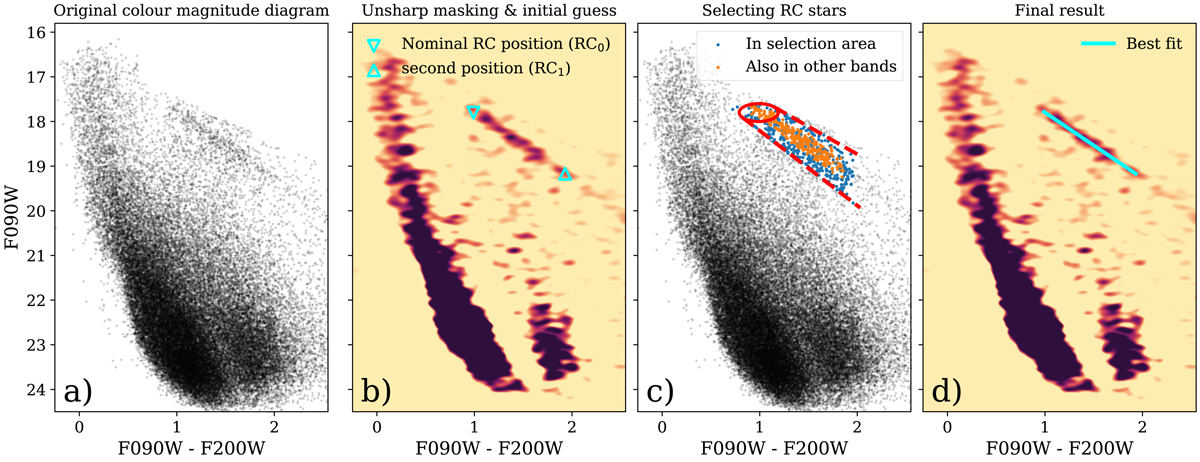
Fig. 2.
Download original image
Illustration of RC star selection. From left to right: panel a shows the original F090W – F200W CMD and panel b shows the same CMD after applying unsharp masking. We used this to obtain initial estimates for the blue and red end of the RC sequence as shown by the triangle symbols. Panel c shows the selection of RC stars using these initial estimates to obtain a selection region. Blue dots show all stars in this CMD falling into the selection region while orange dots show the final sample of stars that fall also in similar selection regions for other filter combinations. Panel d shows the final resulting fitted slope.
Current usage metrics show cumulative count of Article Views (full-text article views including HTML views, PDF and ePub downloads, according to the available data) and Abstracts Views on Vision4Press platform.
Data correspond to usage on the plateform after 2015. The current usage metrics is available 48-96 hours after online publication and is updated daily on week days.
Initial download of the metrics may take a while.