Open Access
Fig. 1.
Download original image
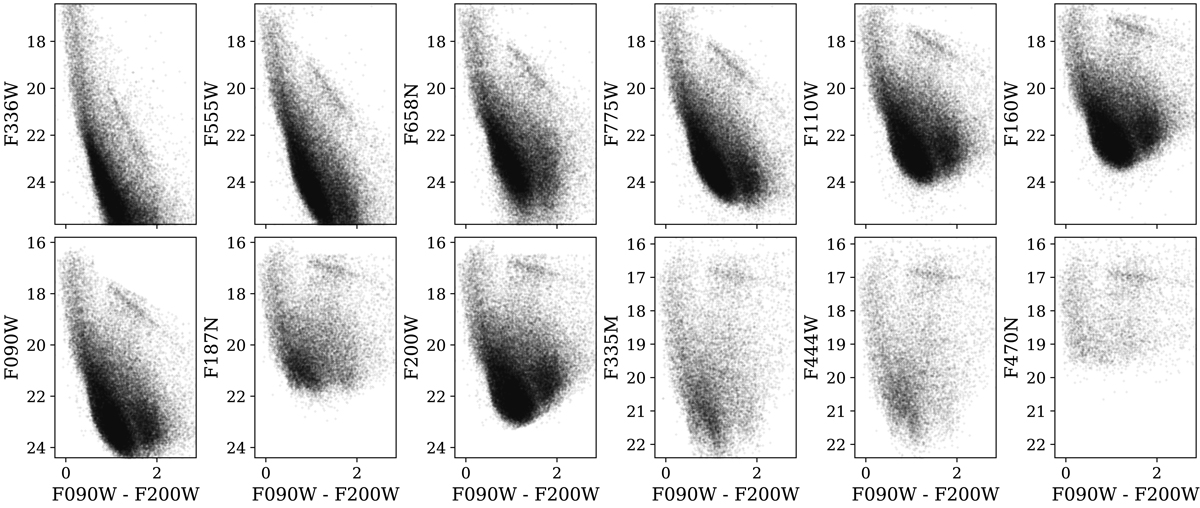
Colour–magnitude diagrams. Each panel shows a different filter on the y-axis and F090W – F200W on the x-axis. Top row: HST filters from the HTTP. Bottom row: NIRCam filters. The RC sequence is visible as a straight sequence that is brighter and redder than the main sequence.
Current usage metrics show cumulative count of Article Views (full-text article views including HTML views, PDF and ePub downloads, according to the available data) and Abstracts Views on Vision4Press platform.
Data correspond to usage on the plateform after 2015. The current usage metrics is available 48-96 hours after online publication and is updated daily on week days.
Initial download of the metrics may take a while.