Fig. 2.
Download original image
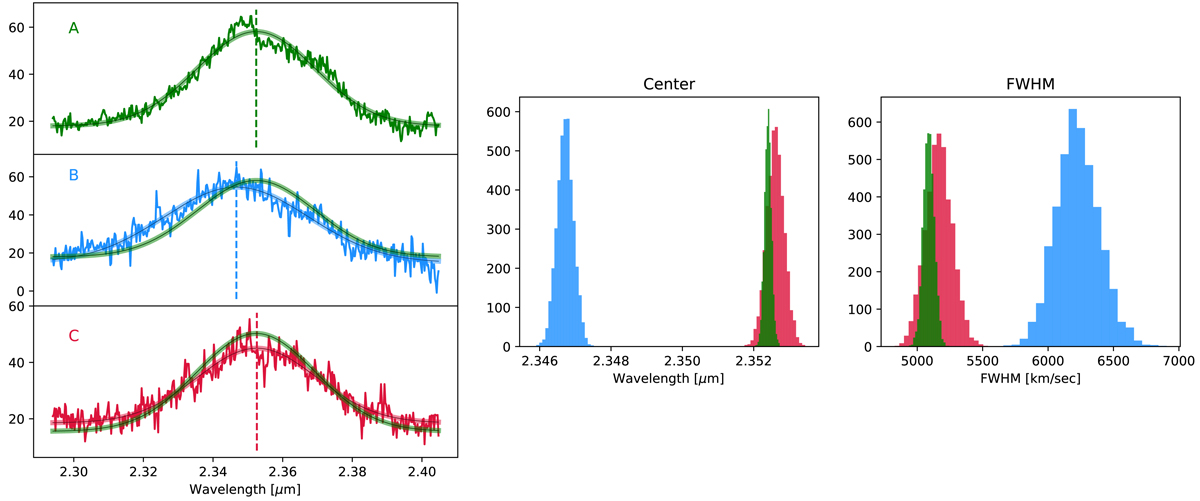
Comparison of the Hα lines of the three components of J1608+2716. Left panels, from top to bottom: A, B, and C components, color-coded as in Fig. 1. Each panel shows the observed emission line scaled to the same flux of component A, and fit with a Gaussian profile plus a constant (shown as a thick solid line with the same color as the corresponding component). The center of the best-fitting Gaussian is reported as a vertical dashed line. For an easy comparison, the fit to component A (the brightest component) is also shown on top of components B and C. Right panels: distributions of the values of centroids and FWHM for the Gaussian fit on 4000 stochastic realizations of the observed spectra, each obtained by injecting noise into the data.
Current usage metrics show cumulative count of Article Views (full-text article views including HTML views, PDF and ePub downloads, according to the available data) and Abstracts Views on Vision4Press platform.
Data correspond to usage on the plateform after 2015. The current usage metrics is available 48-96 hours after online publication and is updated daily on week days.
Initial download of the metrics may take a while.