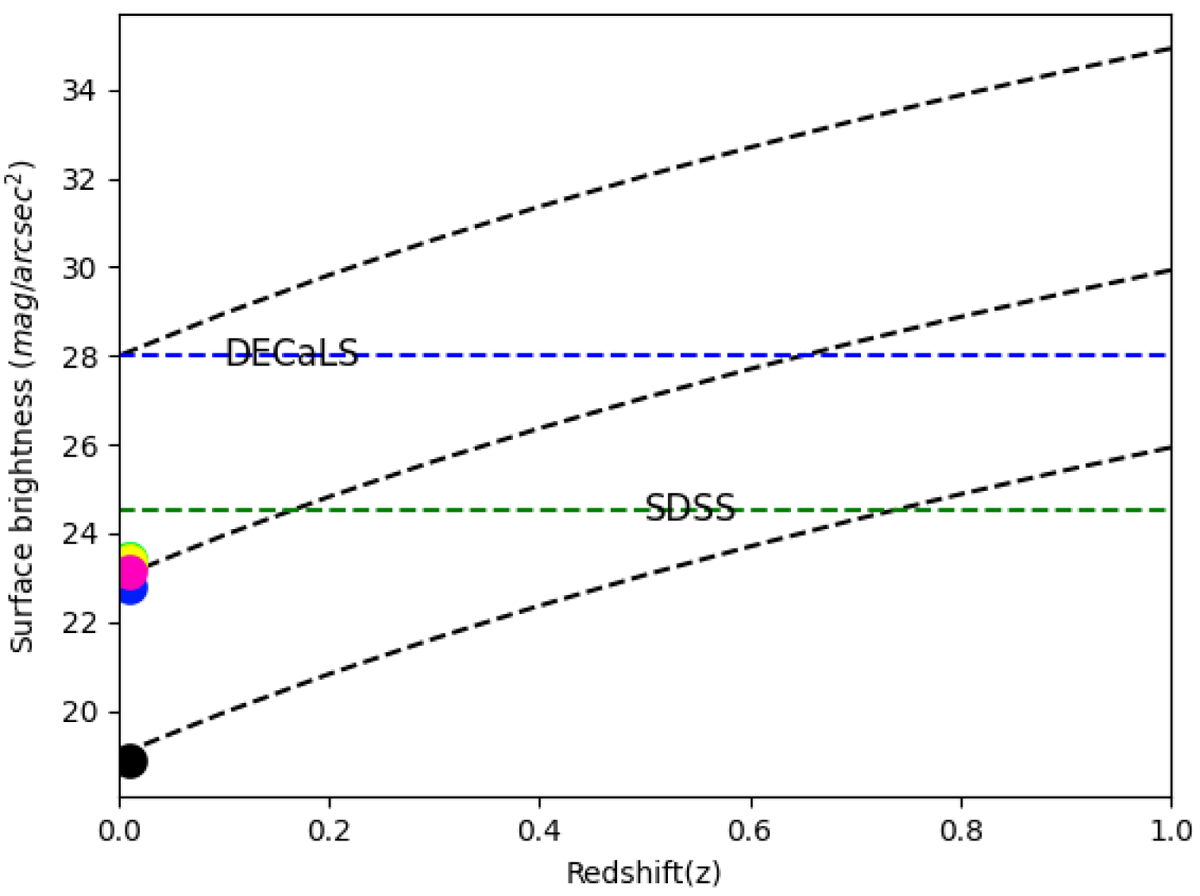
Fig. 5.
Download original image
Surface brightness variation with redshift due to the cosmological dimming (dotted black line). The surface brightness detection limits from the SDSS and DECaLS sky surveys are shown as green and blue lines. The integrated surface brightness of the main body of the galaxy is shown with a black point. The r-band surface brightness from selected regions at the outskirts is shown as coloured points, as in Fig. 2.
Current usage metrics show cumulative count of Article Views (full-text article views including HTML views, PDF and ePub downloads, according to the available data) and Abstracts Views on Vision4Press platform.
Data correspond to usage on the plateform after 2015. The current usage metrics is available 48-96 hours after online publication and is updated daily on week days.
Initial download of the metrics may take a while.