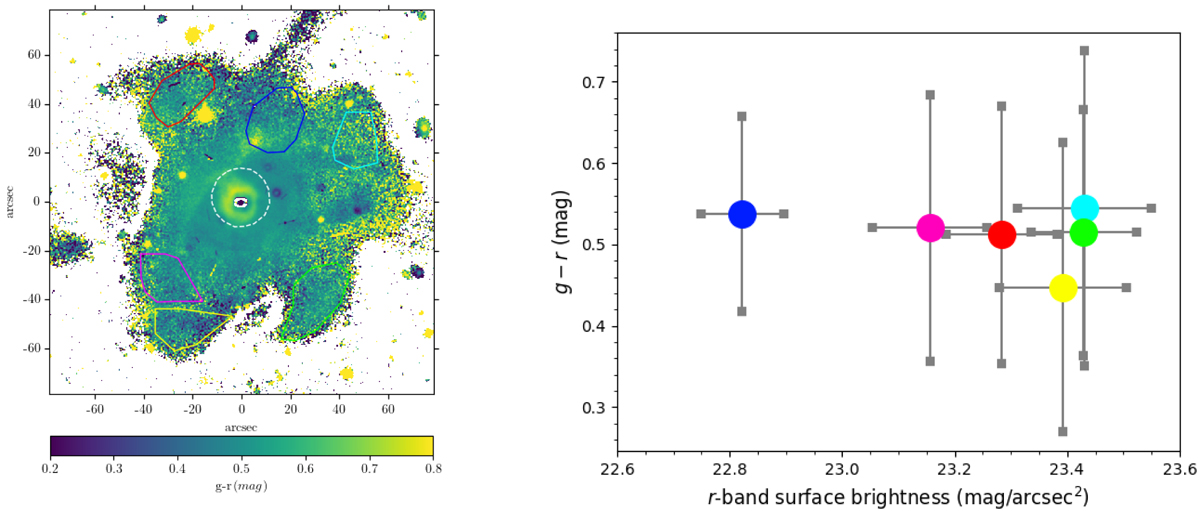
Fig. 3.
Download original image
g − r color map of NGC 7252. The g − r colour is computed from selected regions along the low surface brightness merger features marked in differently coloured polygons. The galaxy main body is marked with a white outline. The r-band surface brightness from selected regions is plotted against the g − r colour. The colour scheme of points is the same as in the selected regions.
Current usage metrics show cumulative count of Article Views (full-text article views including HTML views, PDF and ePub downloads, according to the available data) and Abstracts Views on Vision4Press platform.
Data correspond to usage on the plateform after 2015. The current usage metrics is available 48-96 hours after online publication and is updated daily on week days.
Initial download of the metrics may take a while.