Fig. 5.
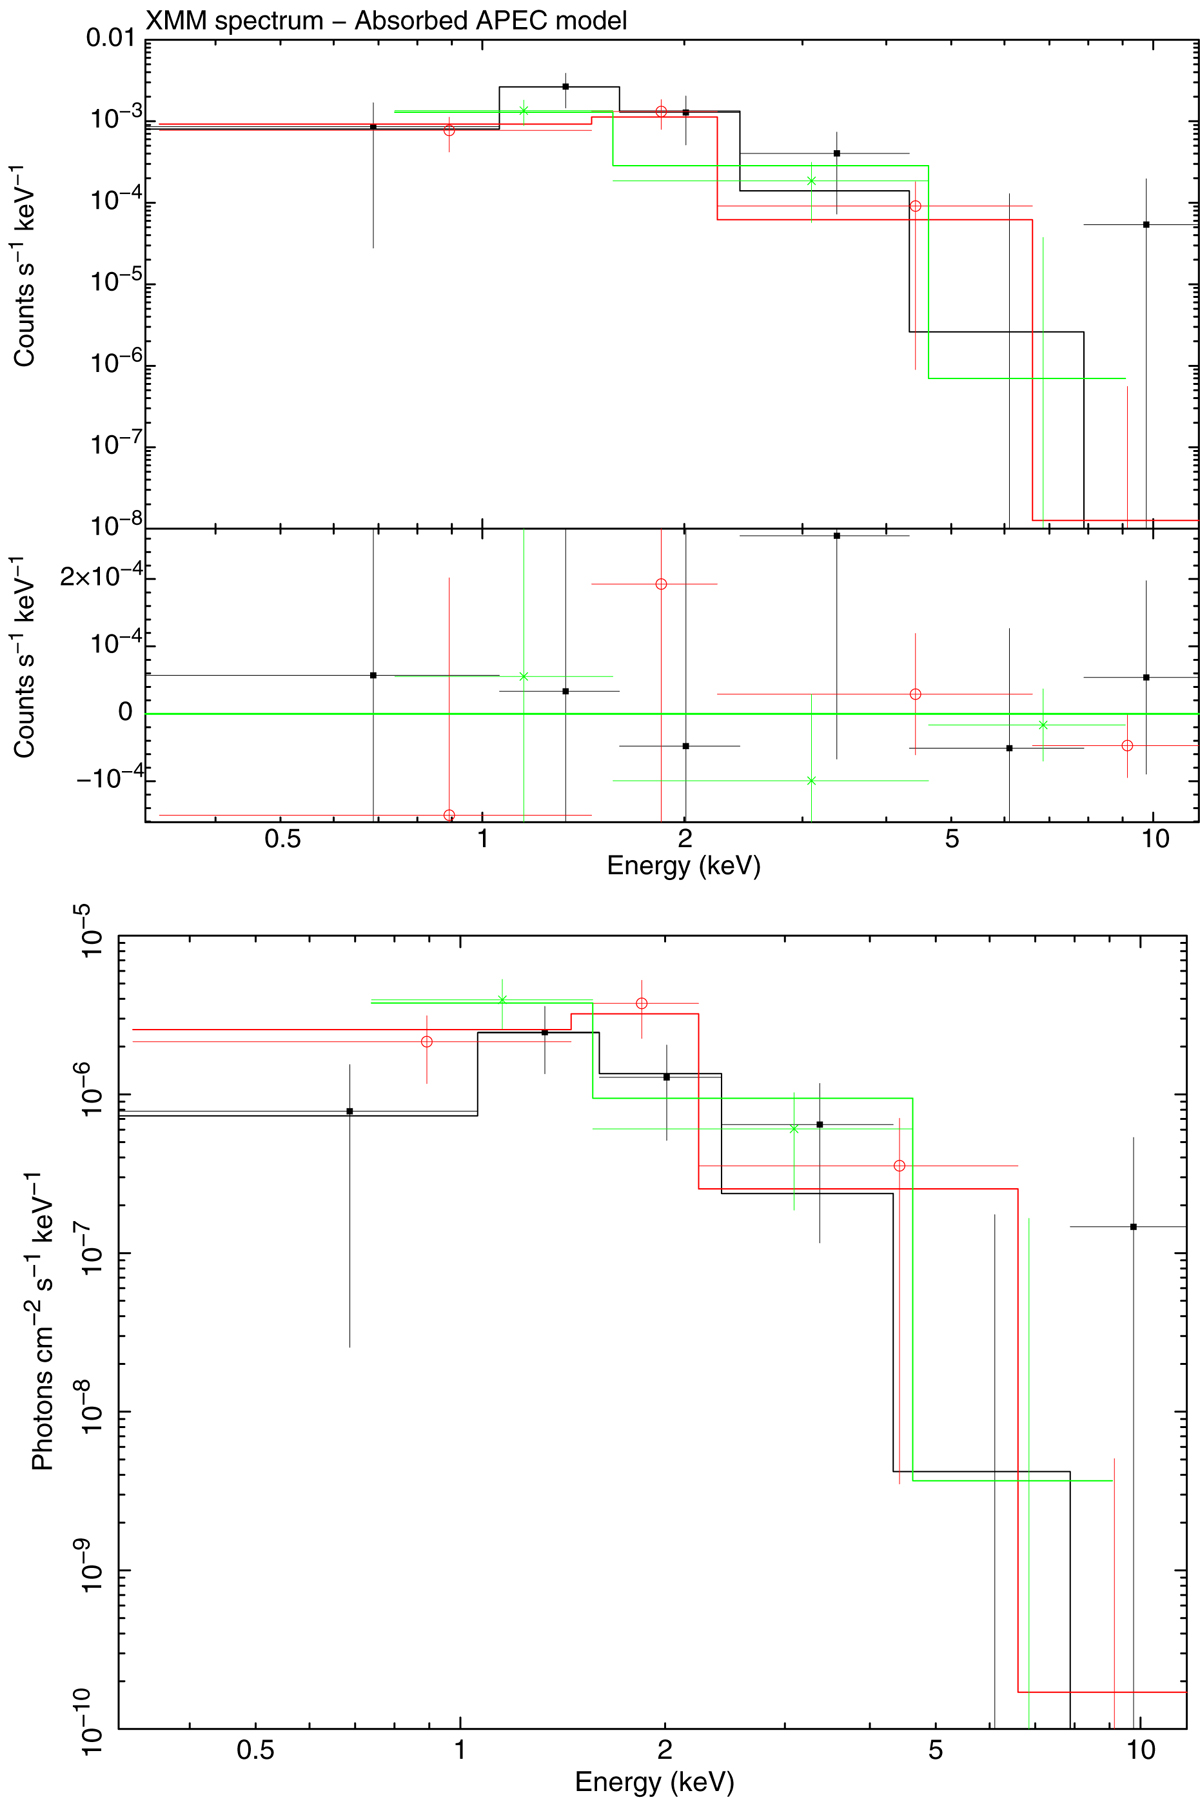
Download original image
XMM-Newton spectrum fitted with the apec model. The upper panel shows the data together with the residuals. The lower panel displays the photon spectrum. Symbols have the following meaning: EPIC pn is marked by black solid squares, MOS 1 by red open circles and MOS 2 by green crosses. The spectrum has been graphically rebinned, for presentation purposes only.
Current usage metrics show cumulative count of Article Views (full-text article views including HTML views, PDF and ePub downloads, according to the available data) and Abstracts Views on Vision4Press platform.
Data correspond to usage on the plateform after 2015. The current usage metrics is available 48-96 hours after online publication and is updated daily on week days.
Initial download of the metrics may take a while.