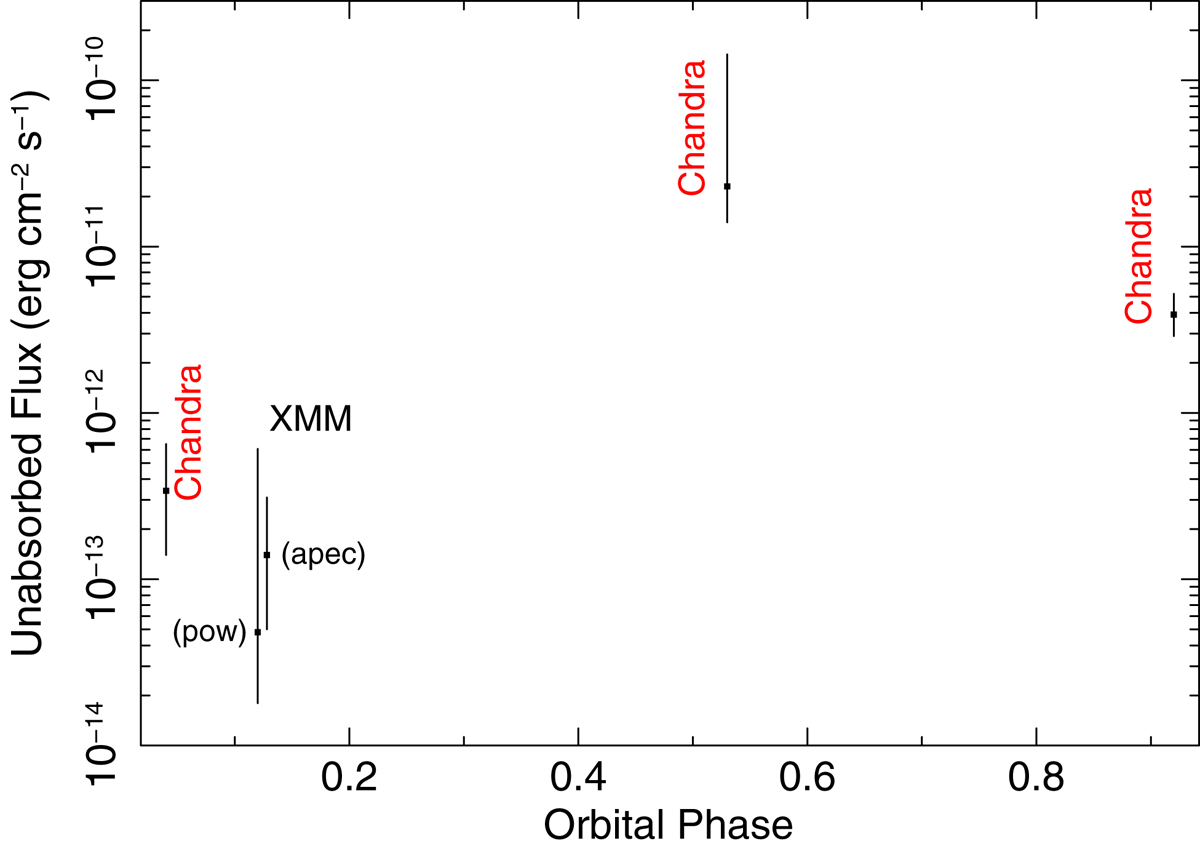
Fig. 3.
Download original image
Source fluxes corrected for the absorption (0.5–10 keV) versus the orbital phase. For the XMM-Newton observations we report two values (slightly shifted in orbital phase to better show the error bars) obtained from the two different continuum models adopted, the power law and the apec model. We note that for two Chandra observations the uncertainties reported in this plot are simply due to the uncertainties in the count rate assuming a fixed spectral shape (see text), while it is only in the Chandra obsID 24086 (at ϕ = 0.53) that the flux and its uncertainty are the outcome of the spectral analysis.
Current usage metrics show cumulative count of Article Views (full-text article views including HTML views, PDF and ePub downloads, according to the available data) and Abstracts Views on Vision4Press platform.
Data correspond to usage on the plateform after 2015. The current usage metrics is available 48-96 hours after online publication and is updated daily on week days.
Initial download of the metrics may take a while.