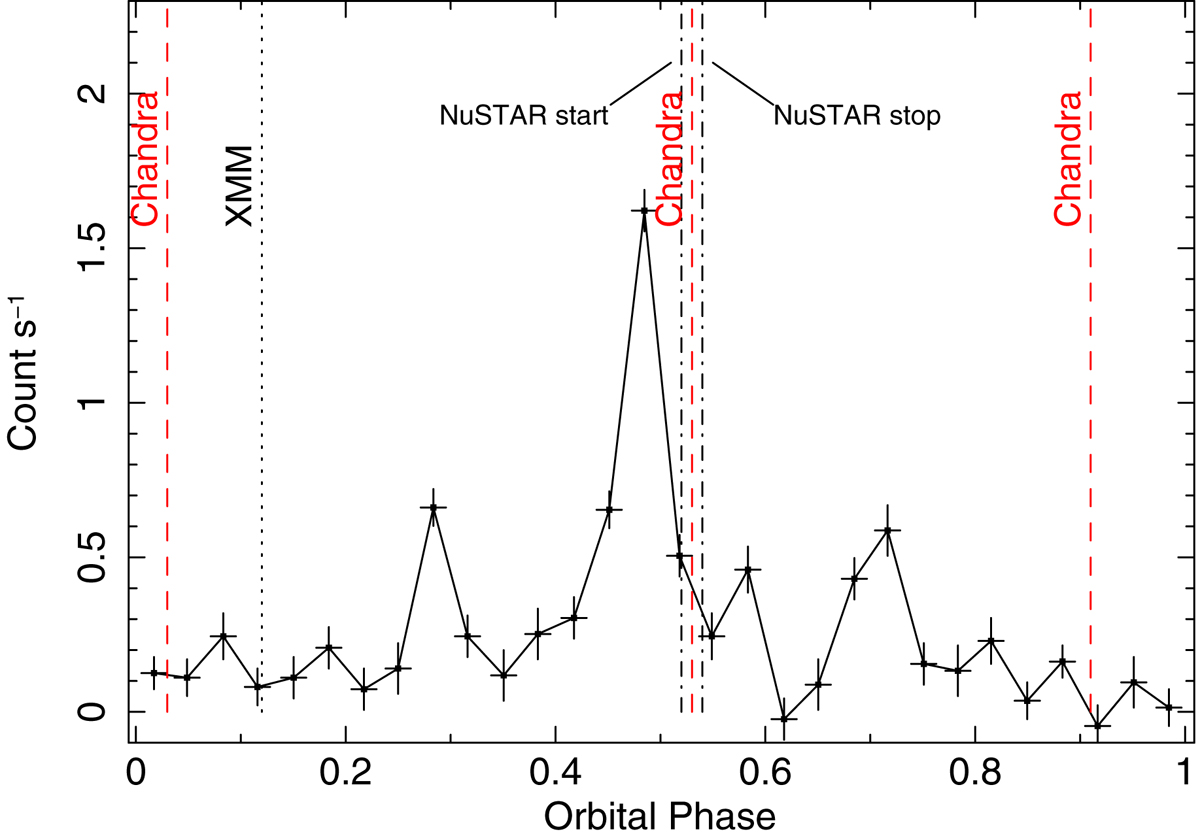
Fig. 1.
Download original image
Orbital phases (marked by vertical lines) of the Chandra (red dashed lines), XMM-Newton (black dotted line), and NuSTAR observations (where we indicate the phase of the start and stop times) overlaid on the INTEGRAL/IBIS/ISGRI orbital curve of XTE J1739−302, we have drawn from Drave et al. (2010). We remark that the uncertainty on the position of the vertical lines is Δϕ = ±0.05, extrapolating Drave’s ephemeris at the time of these observations.
Current usage metrics show cumulative count of Article Views (full-text article views including HTML views, PDF and ePub downloads, according to the available data) and Abstracts Views on Vision4Press platform.
Data correspond to usage on the plateform after 2015. The current usage metrics is available 48-96 hours after online publication and is updated daily on week days.
Initial download of the metrics may take a while.