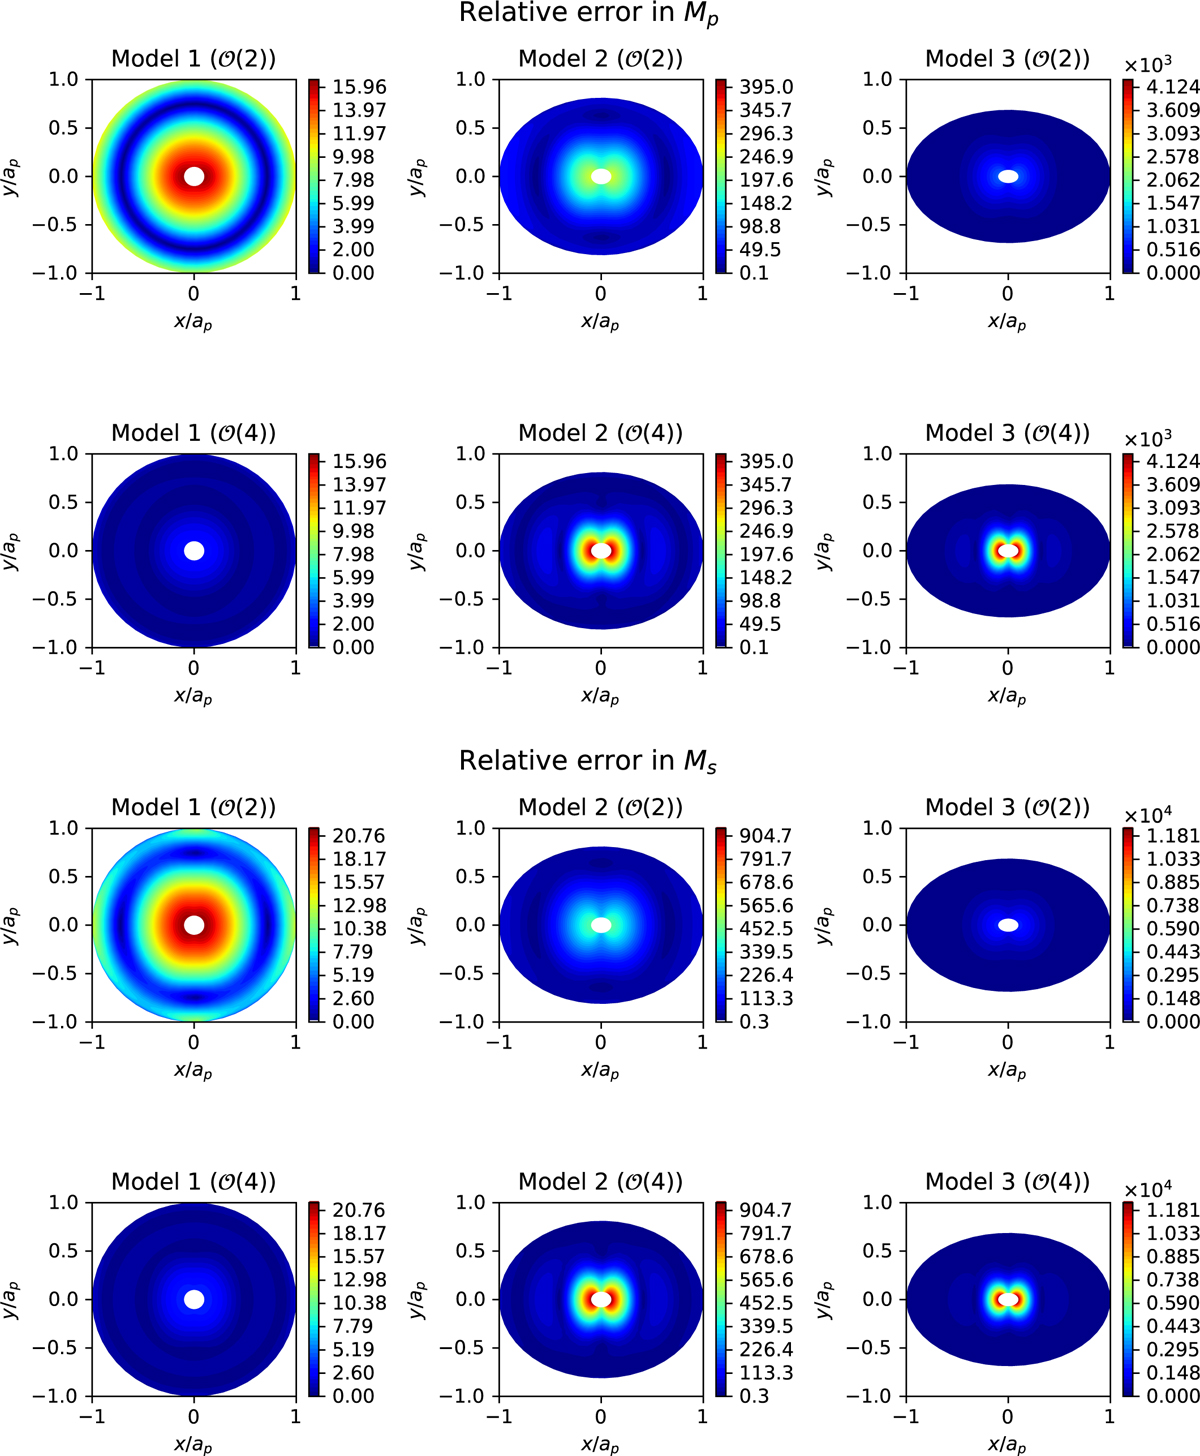
Fig. 7
Download original image
Same as Fig. 6, but now showing the error in the computed torques on both bodies. The first and second rows show the relative differences in the torque on the primary Mp, while the third and fourth rows show the difference in the torque on the secondary Ms. Within the white region, the torques acted on the bodies are zero, and we have chosen to exclude this region from the plot as it is difficult to show relative error in M when M is close to zero.
Current usage metrics show cumulative count of Article Views (full-text article views including HTML views, PDF and ePub downloads, according to the available data) and Abstracts Views on Vision4Press platform.
Data correspond to usage on the plateform after 2015. The current usage metrics is available 48-96 hours after online publication and is updated daily on week days.
Initial download of the metrics may take a while.