Fig. 6
Download original image
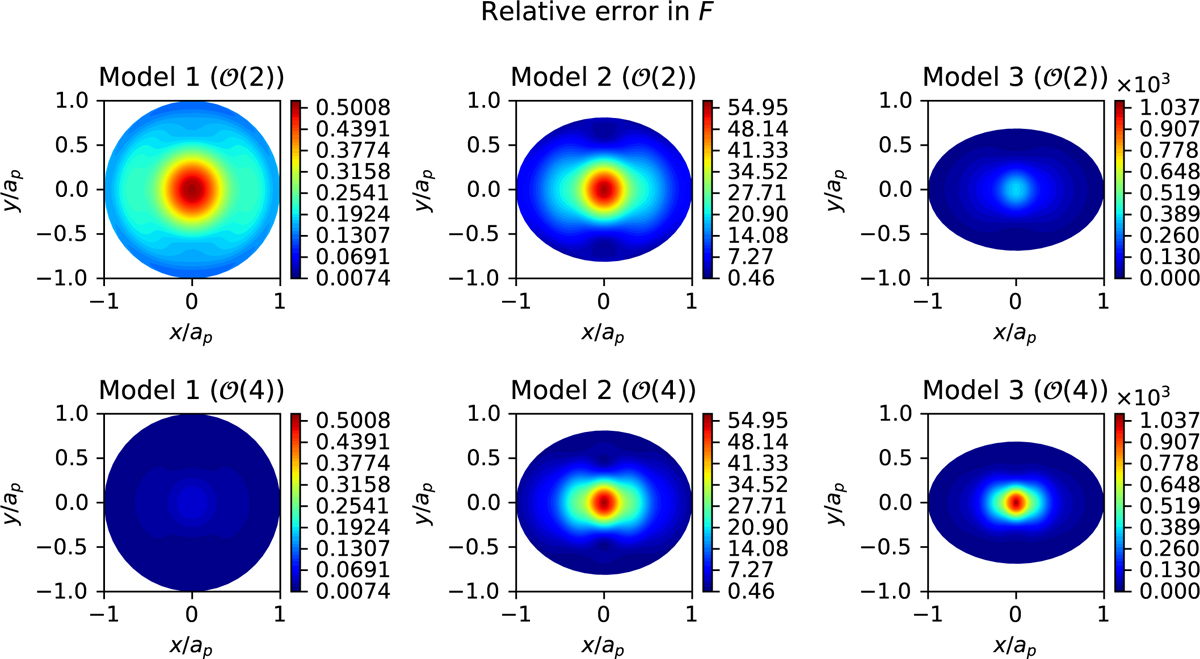
Percentage difference between force F from GUBAS using second and fourth order potentials, relative to force from surface integration method. The xy-plane shows the surface of the primary viewed from the top, along the z-axis. Each point in the plane corresponds to a surface connection point on the primary, that is, a new position of the secondary. The top and bottom panels are for second and fourth order approximations, respectively, and the panels show results for three different models of the primary, see Table 1. The pair-wise comparisons between second and fourth order potentials share the same color scaling.
Current usage metrics show cumulative count of Article Views (full-text article views including HTML views, PDF and ePub downloads, according to the available data) and Abstracts Views on Vision4Press platform.
Data correspond to usage on the plateform after 2015. The current usage metrics is available 48-96 hours after online publication and is updated daily on week days.
Initial download of the metrics may take a while.