Fig. 2
Download original image
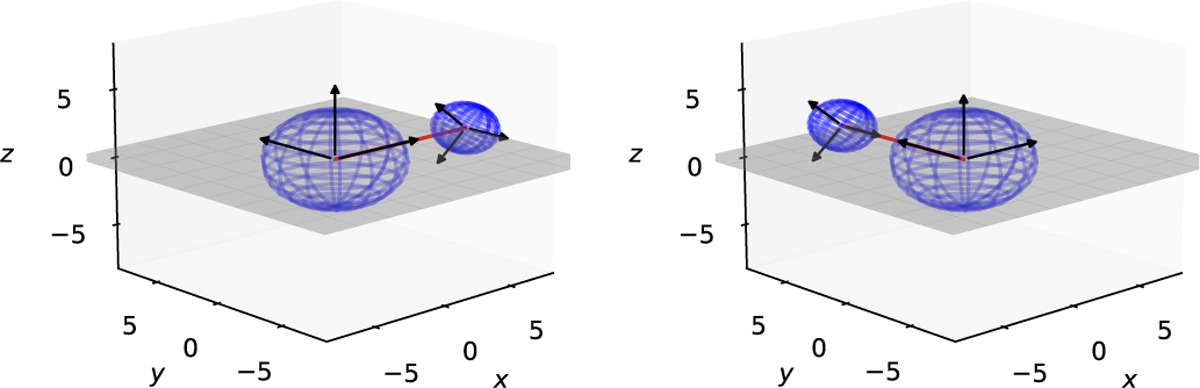
Illustration of how the secondary is placed in the xy-plane of the primary. The red line corresponds to the separation vector r between the centroids. In the left panel, r is parallel to one of the principal axes of the primary, whereas in the right panel, it is parallel to a principal axis of both bodies. The axes are given in dimensionless quantities.
Current usage metrics show cumulative count of Article Views (full-text article views including HTML views, PDF and ePub downloads, according to the available data) and Abstracts Views on Vision4Press platform.
Data correspond to usage on the plateform after 2015. The current usage metrics is available 48-96 hours after online publication and is updated daily on week days.
Initial download of the metrics may take a while.