Fig. 5.

Download original image
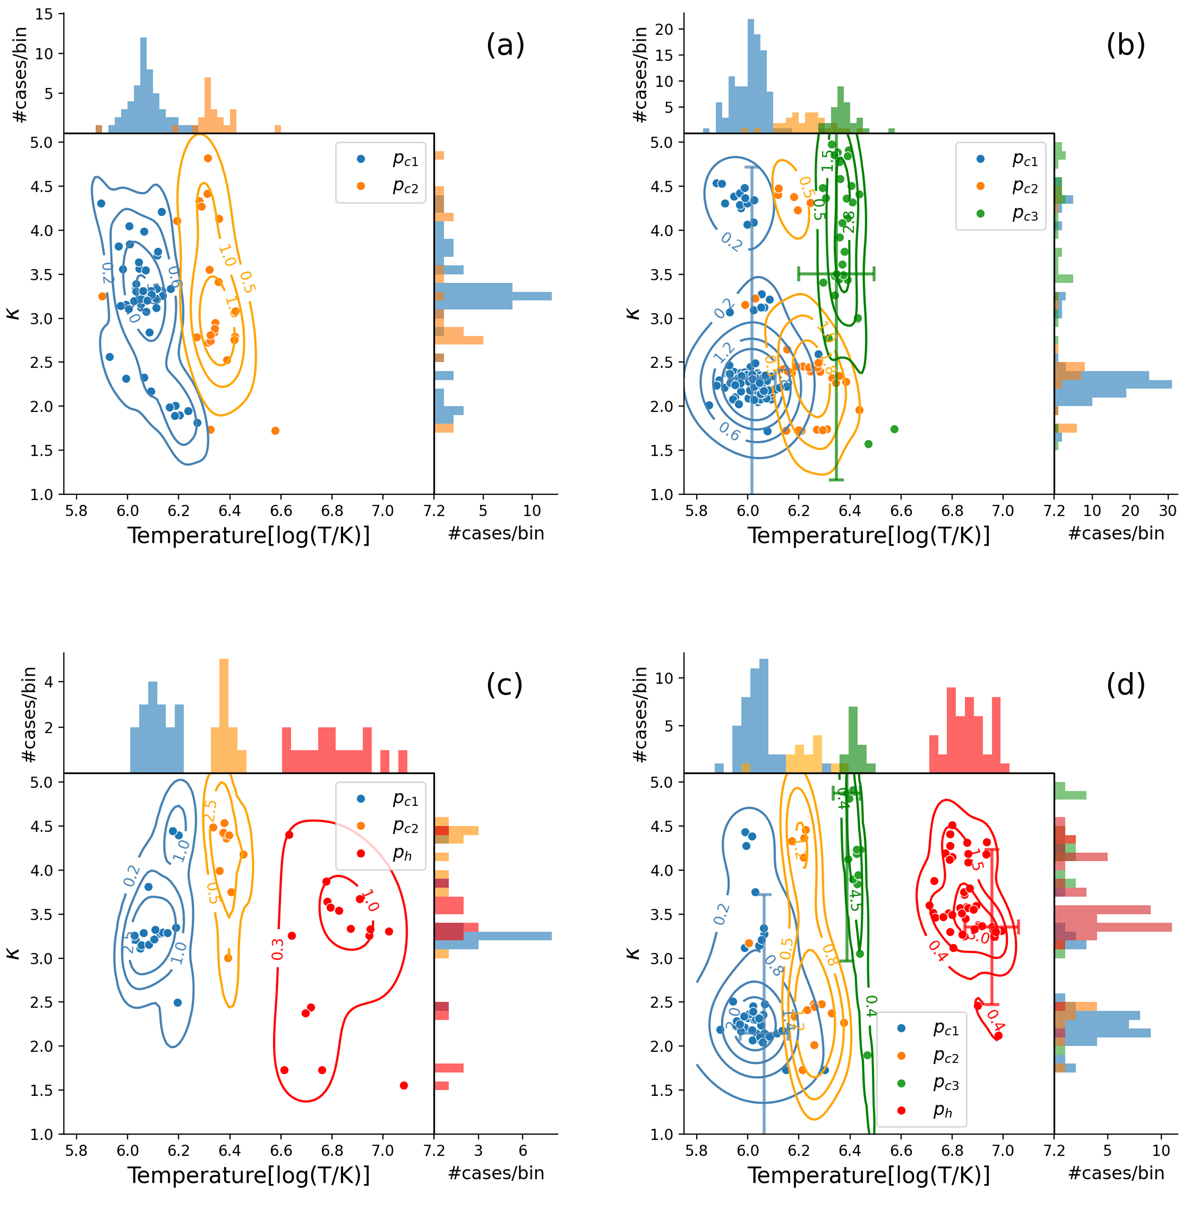
Distribution of temperature and κ for each majority population of a certain type of ICME. A KDE plot is also provided in each subplot together with related histograms. For the histograms, there are 40 bins. κ here has been filtered to be no more than 5. The proportion of each data set that meets this criteria is as follows: (a) Type Cβ (66.7% C1, 28.2% C2). (b) Type Cα (77.9% C1, 22.1% C2, 21.4% C3). (c) Type Hβ (70.8% C1, 41.7% C2, 66.7% H). (d) Type Hα (83.0% C1, 26.4% C2, 24.5% C3, 86.8% H).
Current usage metrics show cumulative count of Article Views (full-text article views including HTML views, PDF and ePub downloads, according to the available data) and Abstracts Views on Vision4Press platform.
Data correspond to usage on the plateform after 2015. The current usage metrics is available 48-96 hours after online publication and is updated daily on week days.
Initial download of the metrics may take a while.


