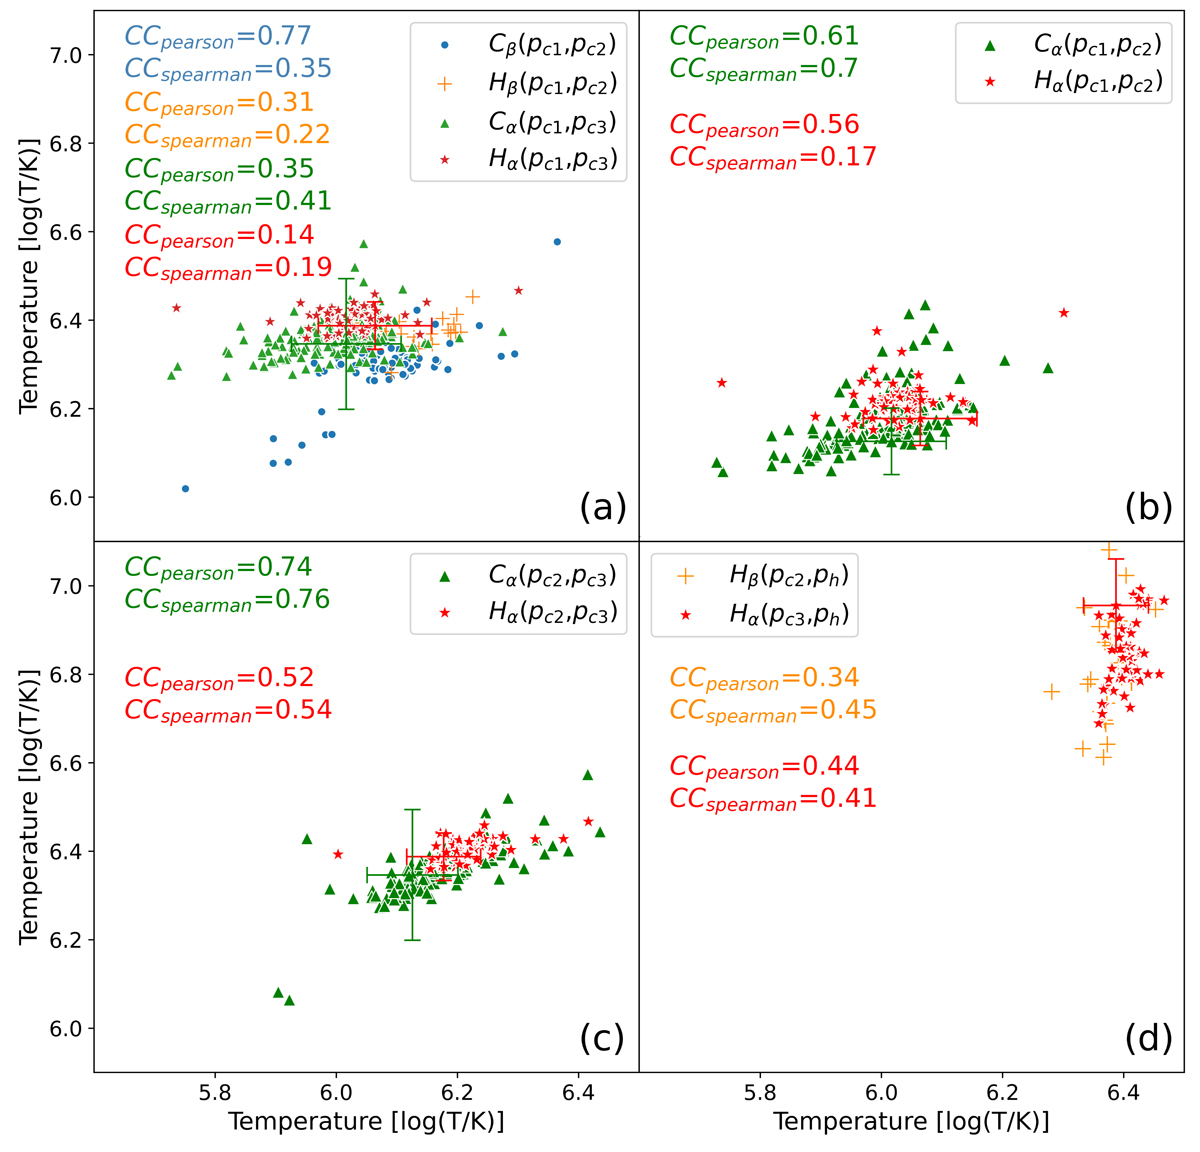
Fig. 4.
Download original image
Scatter plot for freeze-in temperatures of two selected populations in four types, details have been marked in the legend. Cβ(pc1,pc2) means the horizontal coordinate is the temperature of Cβ-pc1, while the vertical coordinate is the temperature of Cβ-pc2. The error bar for Case No. 96 estimated from Test. 3 is marked as well, together with the error bar for Case No. 179. (a) Scatter plot for freeze-in temperatures of Type Cα and Type Hα. (b) Scatter plot for freeze-in temperatures of two neighboring populations of Type Cα and Type Hα. (c) Scatter plot for freeze-in temperatures of two neighboring populations of Type Cα and Type Hα. (d) Scatter plot for freeze-in temperatures of hot populations and their neighboring populations of Type Hα and Type Hβ.
Current usage metrics show cumulative count of Article Views (full-text article views including HTML views, PDF and ePub downloads, according to the available data) and Abstracts Views on Vision4Press platform.
Data correspond to usage on the plateform after 2015. The current usage metrics is available 48-96 hours after online publication and is updated daily on week days.
Initial download of the metrics may take a while.