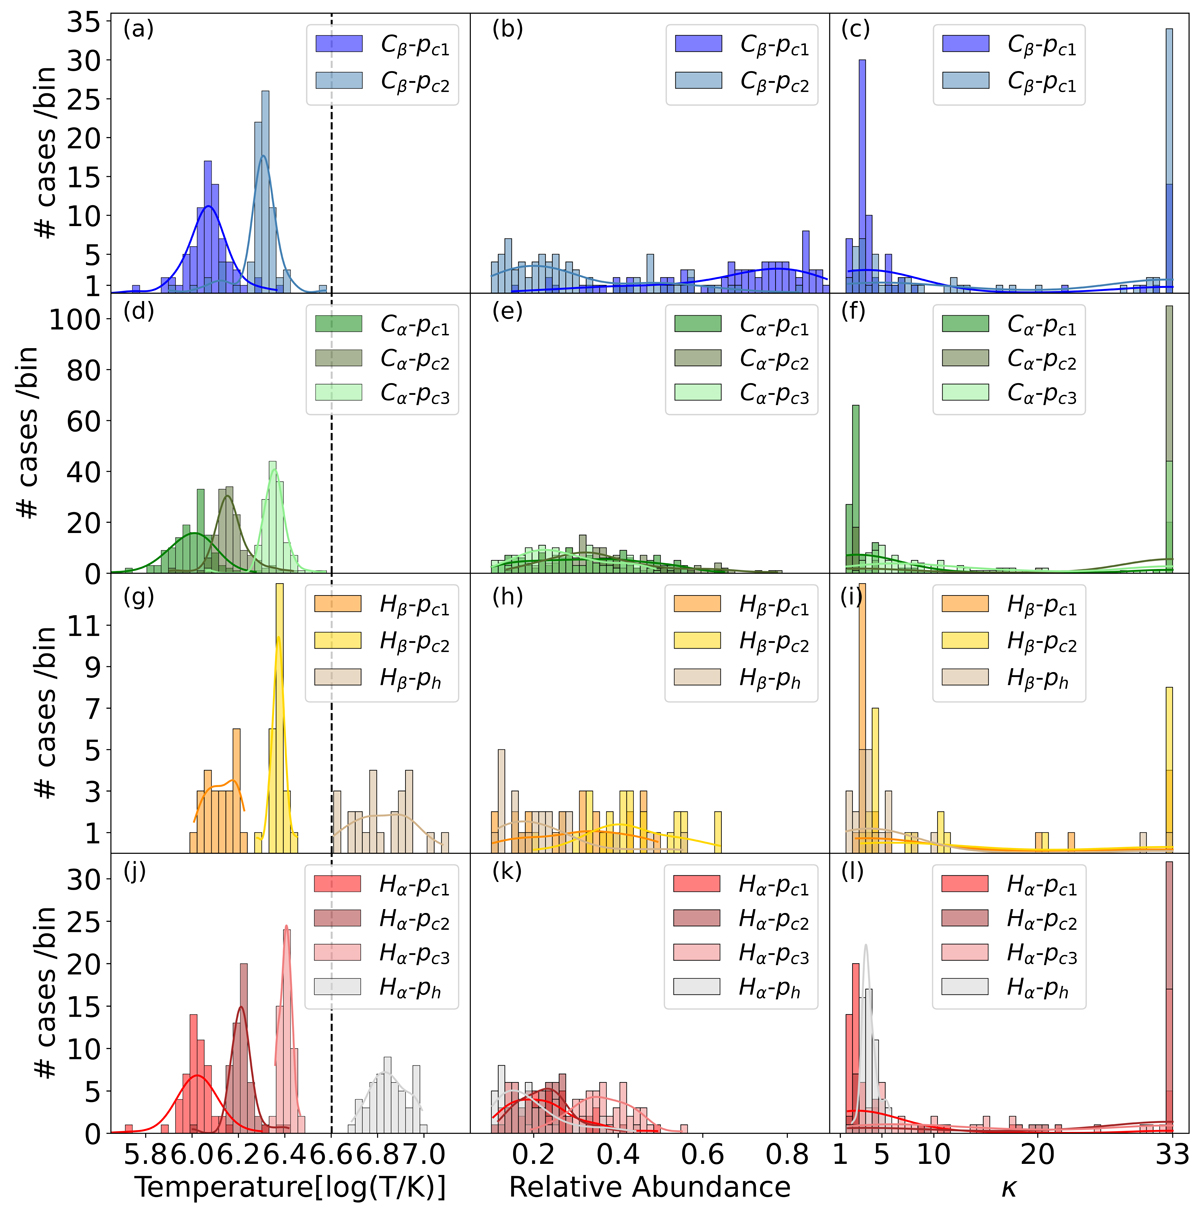
Fig. 3.
Download original image
Histogram of the parameters of the majority populations. From top to bottom are subplots for Type Cβ, Type Cα, Type Hβ, and Type Hα. From left to right are histograms for temperature, relative abundance, and κ of the majority populations that come from corresponding types with 50 bins, and bin ranges of [5.65, 7.2], [0.1, 0.9], and [1.55, 33], respectively. Different colors represent different populations in each type and populations are named independently; e.g., Cβ-pc1 represents cool population number one in Cβ, and Hβ-ph represents hot population in Type Hβ. The black dash line marks the temperature threshold to distinguish cool and hot populations, which is 4 MK.
Current usage metrics show cumulative count of Article Views (full-text article views including HTML views, PDF and ePub downloads, according to the available data) and Abstracts Views on Vision4Press platform.
Data correspond to usage on the plateform after 2015. The current usage metrics is available 48-96 hours after online publication and is updated daily on week days.
Initial download of the metrics may take a while.