Fig. 6.
Download original image
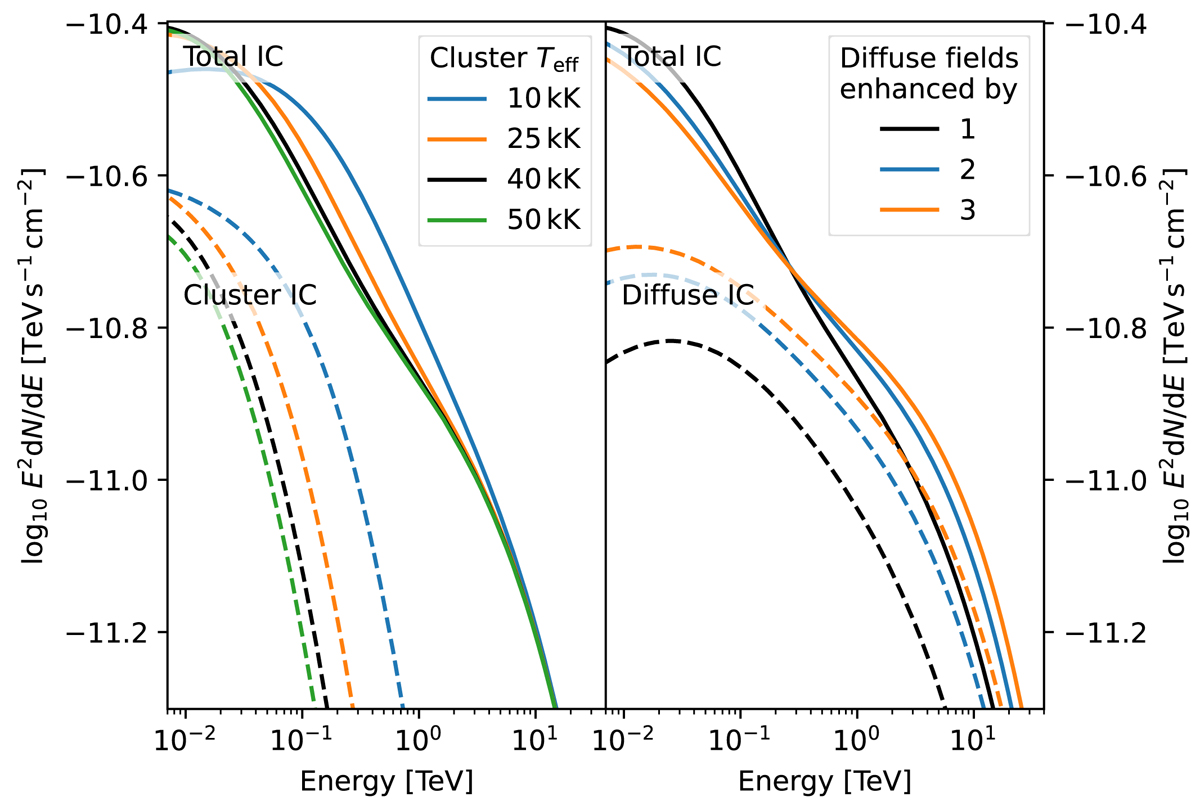
Effect of the variation of the cluster effective temperature (Teff, left) and an enhancement of the diffuse starlight and dust-scattered starlight radiation fields (right). Solid lines indicate the total IC spectrum. Dashed lines show only the cluster component on the left and the diffuse component on the right. Black lines show the best-fitting result using default parameters (Table 1), which is also displayed in Fig. 4 with the dotted blue line. The normalisation of all models is set equal to the default case.
Current usage metrics show cumulative count of Article Views (full-text article views including HTML views, PDF and ePub downloads, according to the available data) and Abstracts Views on Vision4Press platform.
Data correspond to usage on the plateform after 2015. The current usage metrics is available 48-96 hours after online publication and is updated daily on week days.
Initial download of the metrics may take a while.