Fig. 3.
Download original image
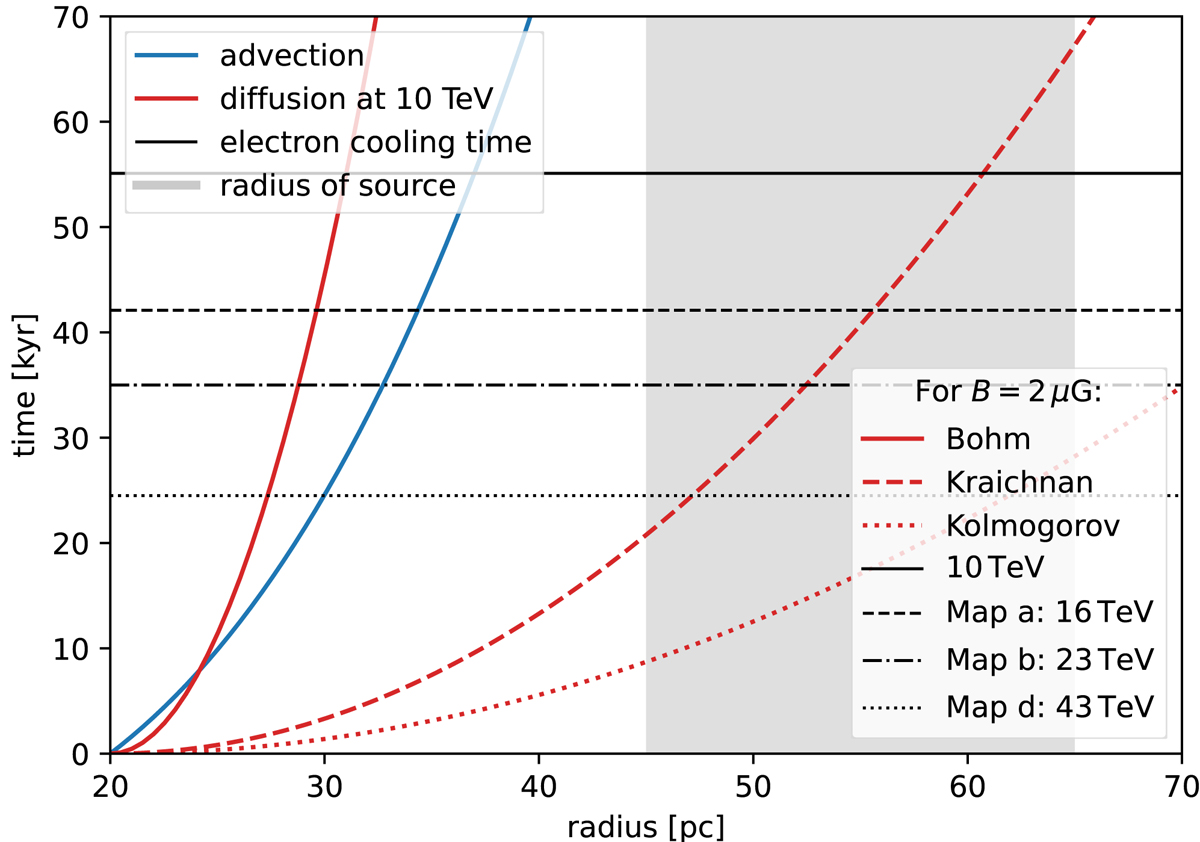
Diffusion (red) and advection (blue) timescales as a function of transported distance, assuming particles start at the termination shock at Rts = 20.4 pc. Timescales for three different diffusion coefficients are shown, following Eqs. (9) and (12). The grey band indicates the radius of the source, where the large range is due to the elongated shape. Cooling times for electrons of four different energies are indicated (black). In addition to a fiducial value (10 TeV), the average parent electron energies we determine for the H.E.S.S. maps (see HC22, Fig. 3) are shown. The technique used is detailed in the text.
Current usage metrics show cumulative count of Article Views (full-text article views including HTML views, PDF and ePub downloads, according to the available data) and Abstracts Views on Vision4Press platform.
Data correspond to usage on the plateform after 2015. The current usage metrics is available 48-96 hours after online publication and is updated daily on week days.
Initial download of the metrics may take a while.