Fig. 3
Download original image
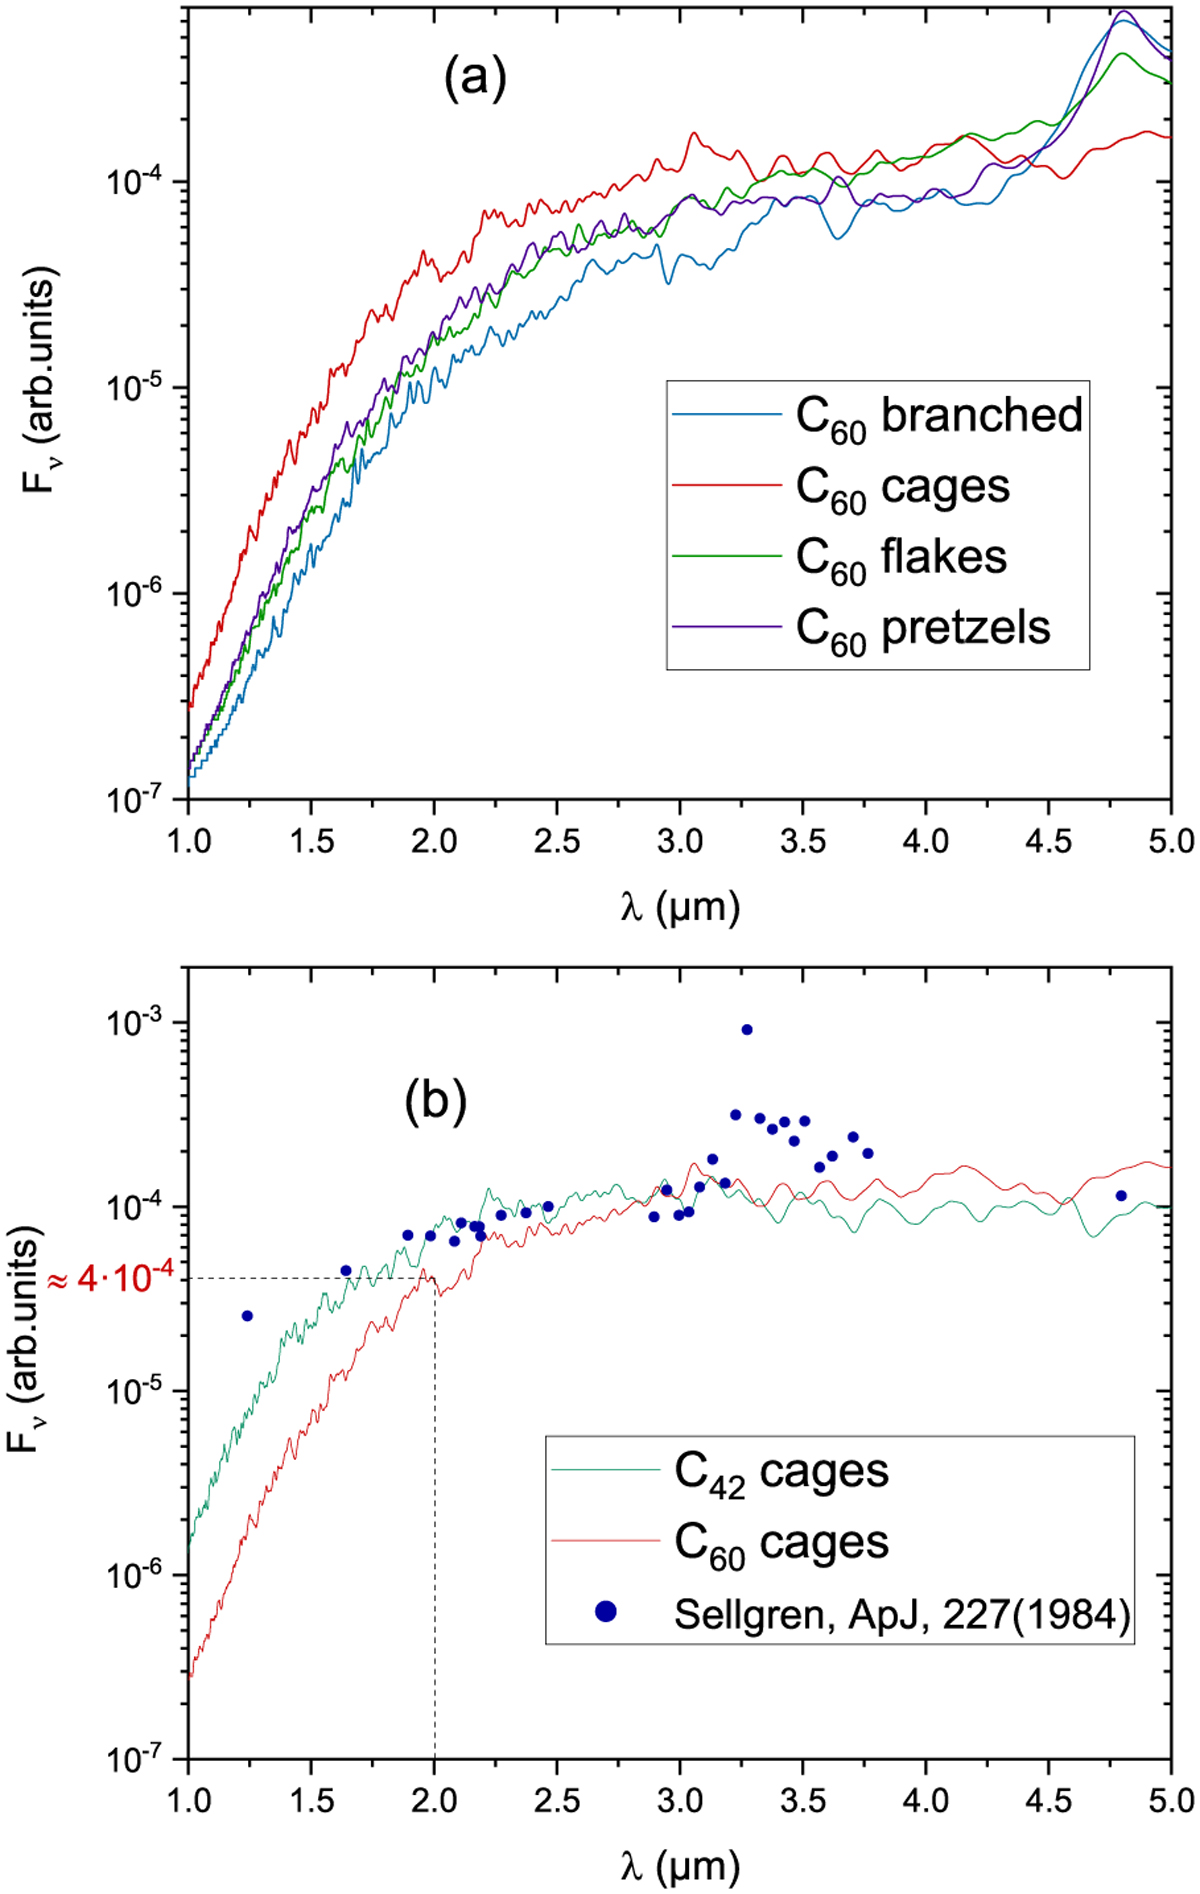
Emission spectra of carbon cluster samples in the near-IR region. Note that Fv is displayed as a function of wavelength, as in Sellgren (1984). The spectra are normalised so the integrated emission is unity. Upper panel: spectra obtained for the four families of C60. Lower panel: spectra obtained for the cage families of C60 and C42. The dashed lines emphasise the relative value of emission intensity of C60 cage sample at 2 μm. Observational data of the NGC 7023 reflection nebulae at 30"W 20"N position, as extracted from Sellgren (1984), are shown as blue dots.
Current usage metrics show cumulative count of Article Views (full-text article views including HTML views, PDF and ePub downloads, according to the available data) and Abstracts Views on Vision4Press platform.
Data correspond to usage on the plateform after 2015. The current usage metrics is available 48-96 hours after online publication and is updated daily on week days.
Initial download of the metrics may take a while.