Fig. 2
Download original image
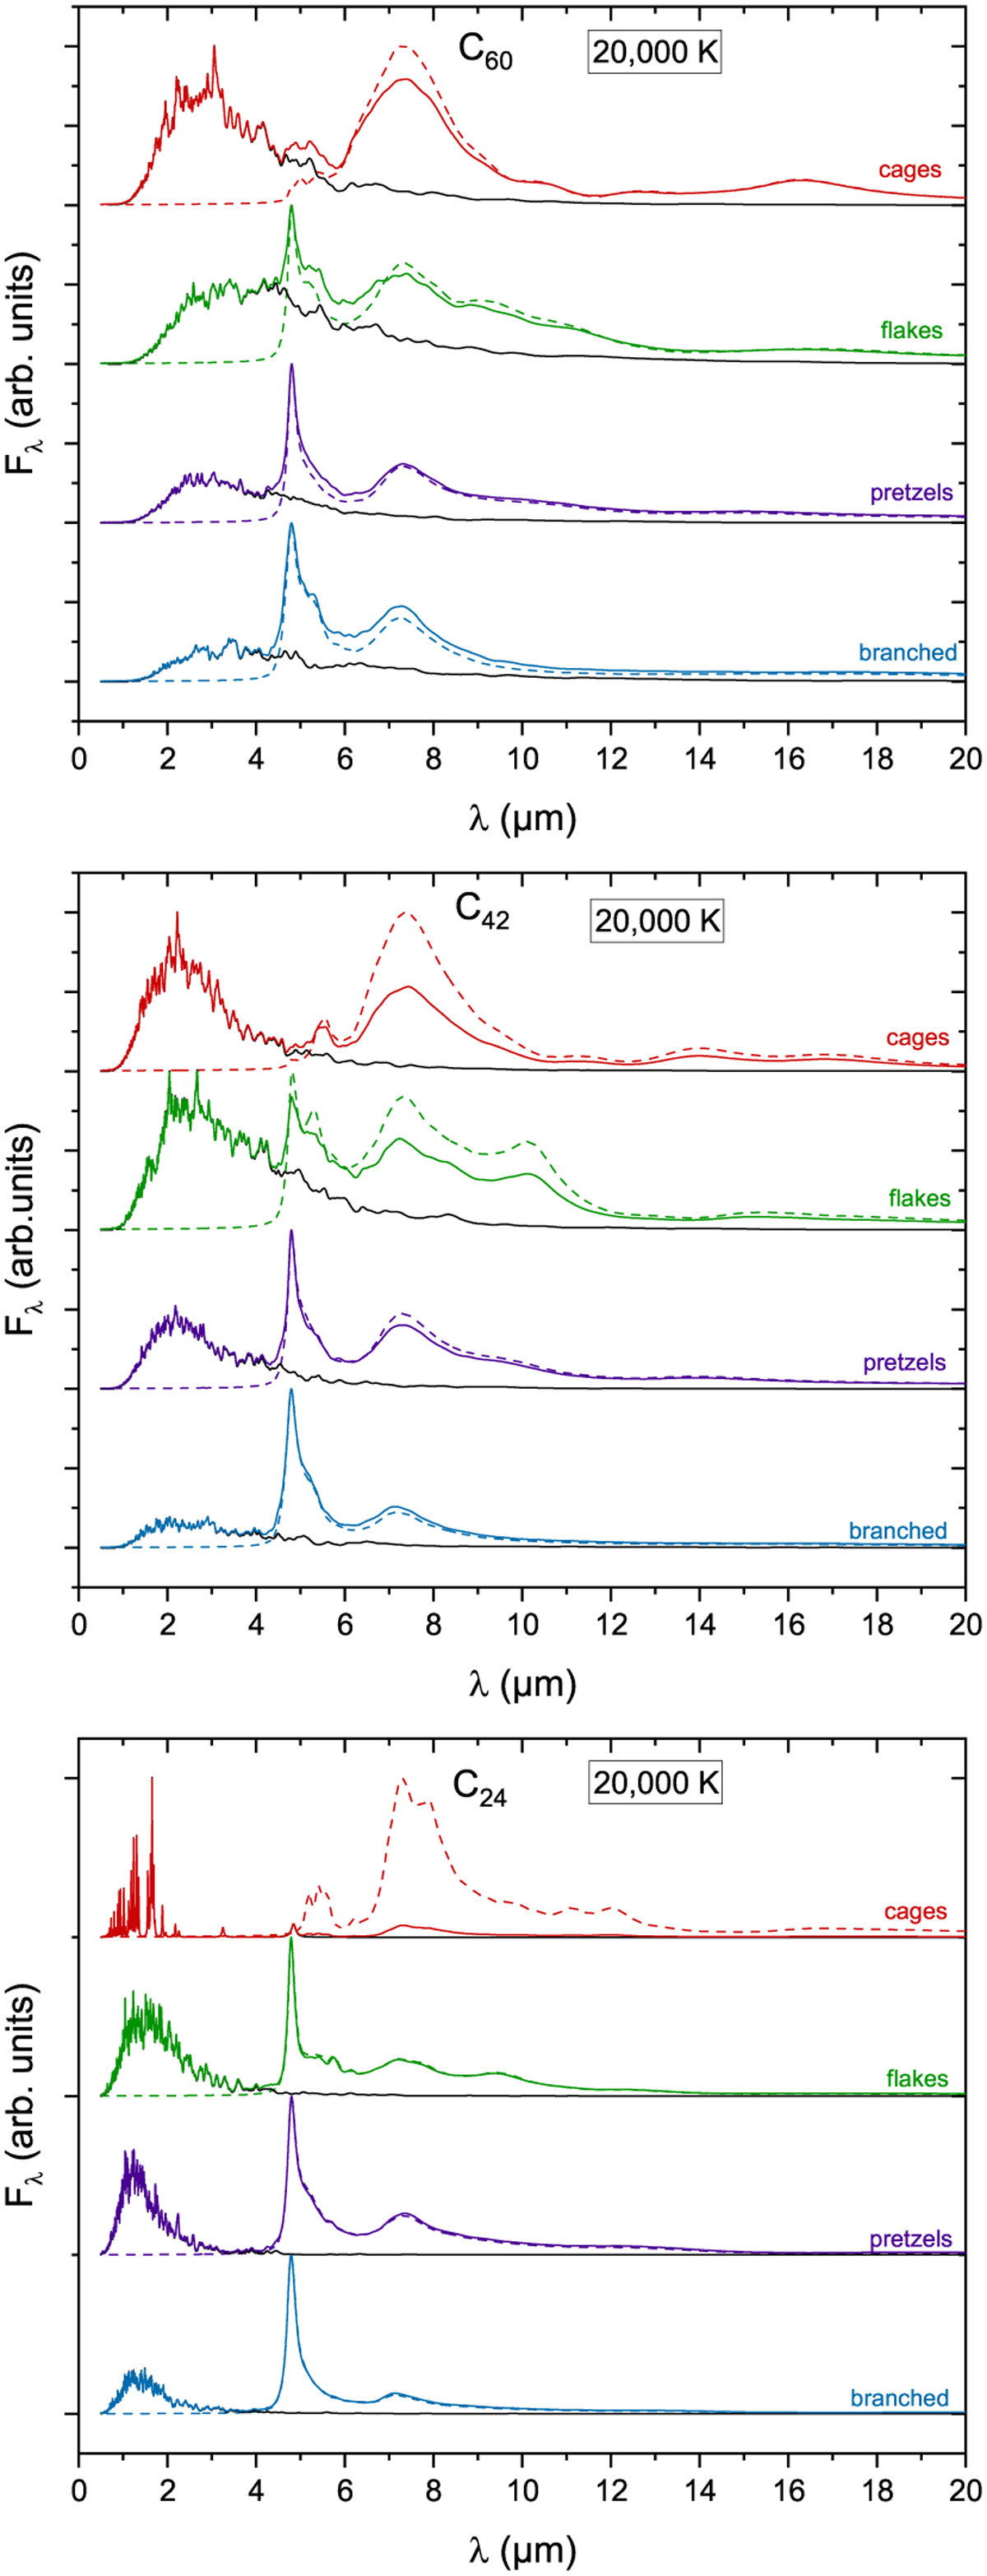
Normalised emission intensity spectra as a function of the wavelength from the four families of cages, flakes, pretzels, and branched structures and the three carbon cluster sizes of 60, 42, and 24 carbon atoms upon irradiation by a 20 000 K star-like SED. The dashed lines highlight the corresponding spectra in which RF processes are ignored. The specific contribution of RF processes is highlighted as black lines.
Current usage metrics show cumulative count of Article Views (full-text article views including HTML views, PDF and ePub downloads, according to the available data) and Abstracts Views on Vision4Press platform.
Data correspond to usage on the plateform after 2015. The current usage metrics is available 48-96 hours after online publication and is updated daily on week days.
Initial download of the metrics may take a while.