Fig. 4
Download original image
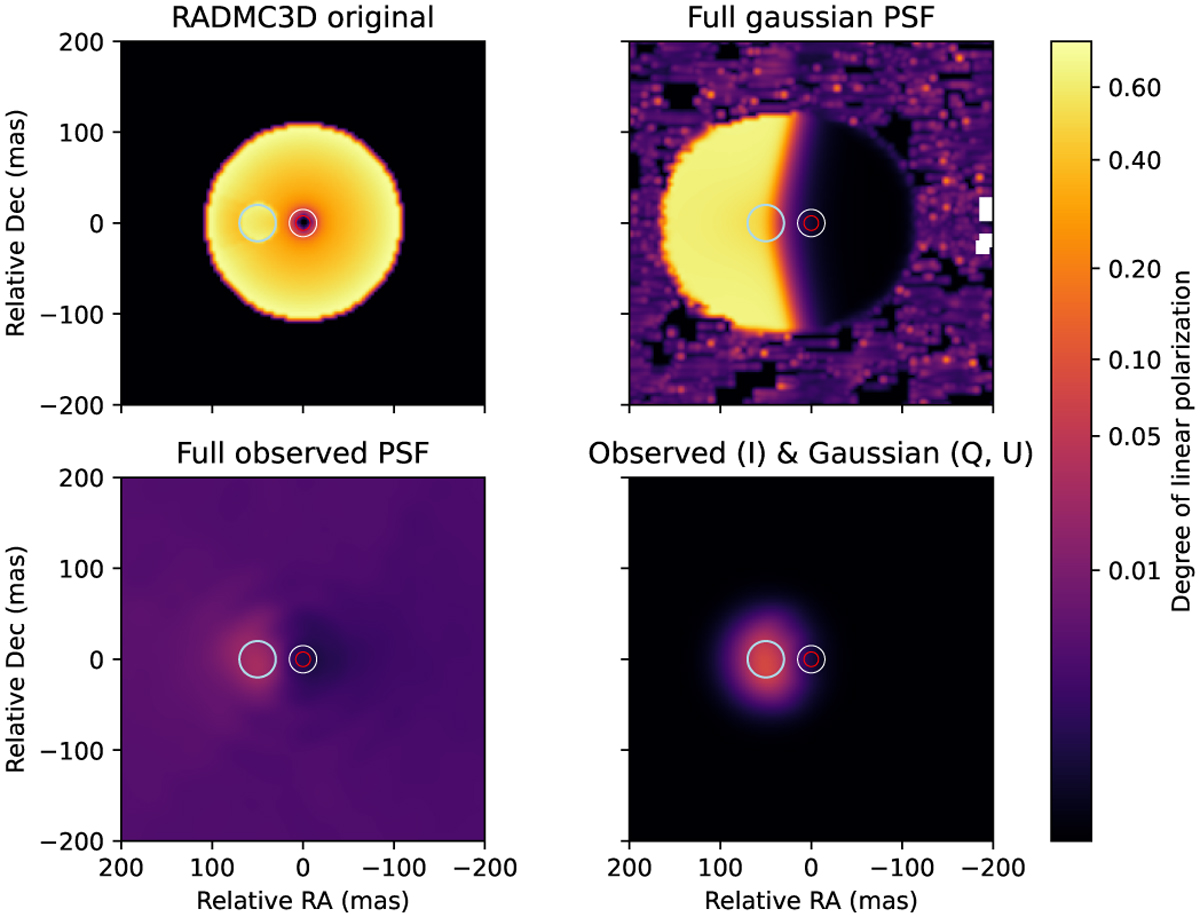
Example of DoLP maps obtained with RADMC3D with different PSF convolutions. All the other parameters of the simulation remain the same. The observation wavelength is 644.9 nm. The color scale is a power law with an exponent of 0.25. The red circle indicates the stellar angular diameter, the white circle corresponds to the PSF reference’s FWHM, and the light blue circle corresponds to the physical localization of the dust clump. Top left: original RADMC3D DoLP. Top right: resultant DoLP after convolution of Stokes I, Q, U signals with a synthetic Gaussian beam of 30 mas FWHM. Bottom left: resultant DoLP after convolution of Stokes I, Q, U with an observed PSF calibrator by ZIMPOL (HD 220340). Bottom right: resultant DoLP after convolution of the Stokes I with the observed PSF reference, and Stokes Q and U with the synthetic Gaussian.
Current usage metrics show cumulative count of Article Views (full-text article views including HTML views, PDF and ePub downloads, according to the available data) and Abstracts Views on Vision4Press platform.
Data correspond to usage on the plateform after 2015. The current usage metrics is available 48-96 hours after online publication and is updated daily on week days.
Initial download of the metrics may take a while.