Open Access
Fig. 10
Download original image
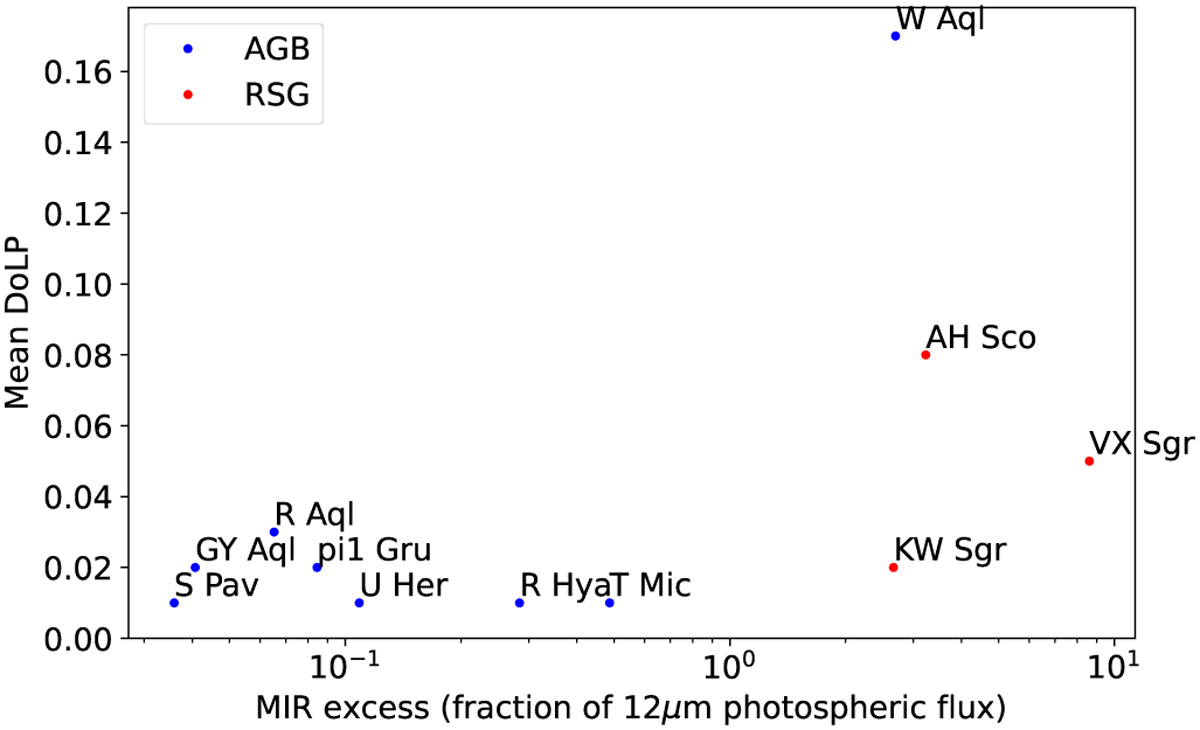
Average DoLP in the inner 50 R⋆ for each source, as a function of the MIR excess expressed as the fraction of the 12 µm photospheric blackbody flux. The RSG stars are in red, and the AGB stars are in blue. We used the filter at the shortest wavelength observed for each star.
Current usage metrics show cumulative count of Article Views (full-text article views including HTML views, PDF and ePub downloads, according to the available data) and Abstracts Views on Vision4Press platform.
Data correspond to usage on the plateform after 2015. The current usage metrics is available 48-96 hours after online publication and is updated daily on week days.
Initial download of the metrics may take a while.