Fig. 7.
Download original image
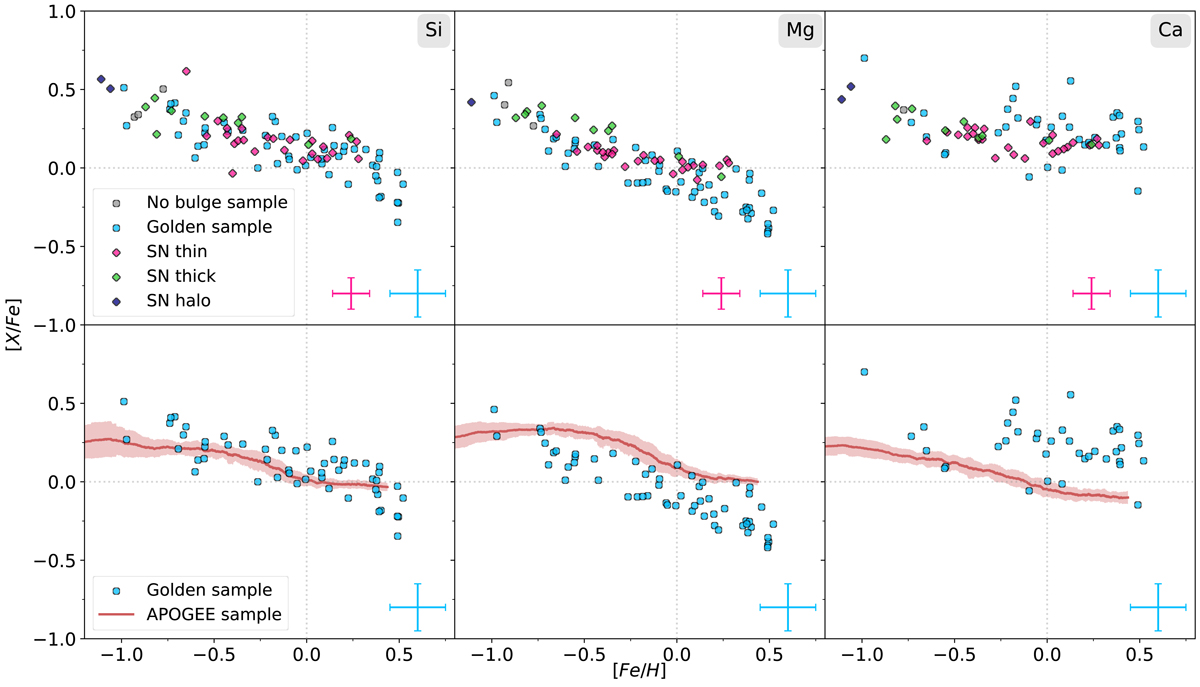
NLTE [Si/Fe], [Mg/Fe], and [Ca/Fe] vs. [Fe/H] trends of our Golden Sample of the inner bulge shown in light blue and compared to solar neighbourhood stars in purple (thin disc), green (thick disc), and dark blue (halo) in the upper panel and compared to the running mean of the updated APOGEE DR17 sample from Zasowski et al. (2019) plotted in red in the lower panel.
Current usage metrics show cumulative count of Article Views (full-text article views including HTML views, PDF and ePub downloads, according to the available data) and Abstracts Views on Vision4Press platform.
Data correspond to usage on the plateform after 2015. The current usage metrics is available 48-96 hours after online publication and is updated daily on week days.
Initial download of the metrics may take a while.